Here we are, ~6 months after BTC capitulation. Now what?

Capitulation is often only seen in retrospect and the indicators are rarely, if ever, those observed by the masses. Which brings us to the ever so popular question, borderline crypto obsession, is the bottom in? My answer is yes, it isn’t and also no, it is. Confused? Well truthfully so am I. I’m confused as to why this fixation persists when in reality, only one gets to buy the absolute bottom of a market, just as only one gets to sell the absolute top. So what I aim to determine is this:
What is the likelihood that the low range has been found?
For this, with some help from Santiment, I'm looking to see what the crowd is saying. So starting with the larger picture, below is a historic view of BTC using weekly candles. The yellow verticals mark the low (for 2019 the lowest low recorded so far) and the blue vertical is a projected area to watch for a possible end of consolidation. The dates outlined begin from each low onwards. The highlighted areas extend from that low to then match the next high and follow consolidation until that high is then broken.
*Our present local high can certainly change and thus should be adjusted as needed.

Additionally, each low and suspected low coincides with the MFI oscillator on the bottom of the chart and the BB %B at the top both measuring in sync. This can be used to identify downtrends, as well as uptrends when the inverse is seen.
*Oscillators have been modified to best suit crypto markets.
Moving on, here is a look at some social volume starting in late 2016 up to the present. Clearly, conversation pertaining to Bitcoin fell off dramatically following ATH. Yet it is also clear that during December 2018 there was a strong social uptick on Reddit. The same can be said for Discord, where elevated conversation has been sustained for the most part. Referring back to the first chart and looking at the PA for the past ~6 months, it seems to show that the crowd has become a bit excited at these levels. Also, the return of overall market volatility strengthens this belief.

It’s probably a good time to mention one thing, although corrections often share many similarities, not all corrections need exhibit the same behavior. This is something worth keeping in mind to help avoid confirmation bias.
That said, here is a look at aged coin consumption from late 2011 to mid 2012. Once again, I’ll reference the first chart which identifies that the significant low for this period, post bull run, was on the 17th of November, 2011. This was just one day after that massive spike in aged coin consumption, as seen below.

Fast forward to the current cycle (2017–2019) and there are three noticeably large spikes once again, with the largest occurring during the beginning of December. As for the 2015 correction, well, there is no correlation to this behavior. Though as I pointed out above, this does not rule out the observation as an indicator of sorts.

Lastly, here’s a look at my favorite Santiment tool at the moment. Not only is it extremely telling but it provides a great visual while still managing not to over complicating things. With a simple price plot and overlay of market capitalization a missing puzzle piece has been added, ‘Realized Value.’

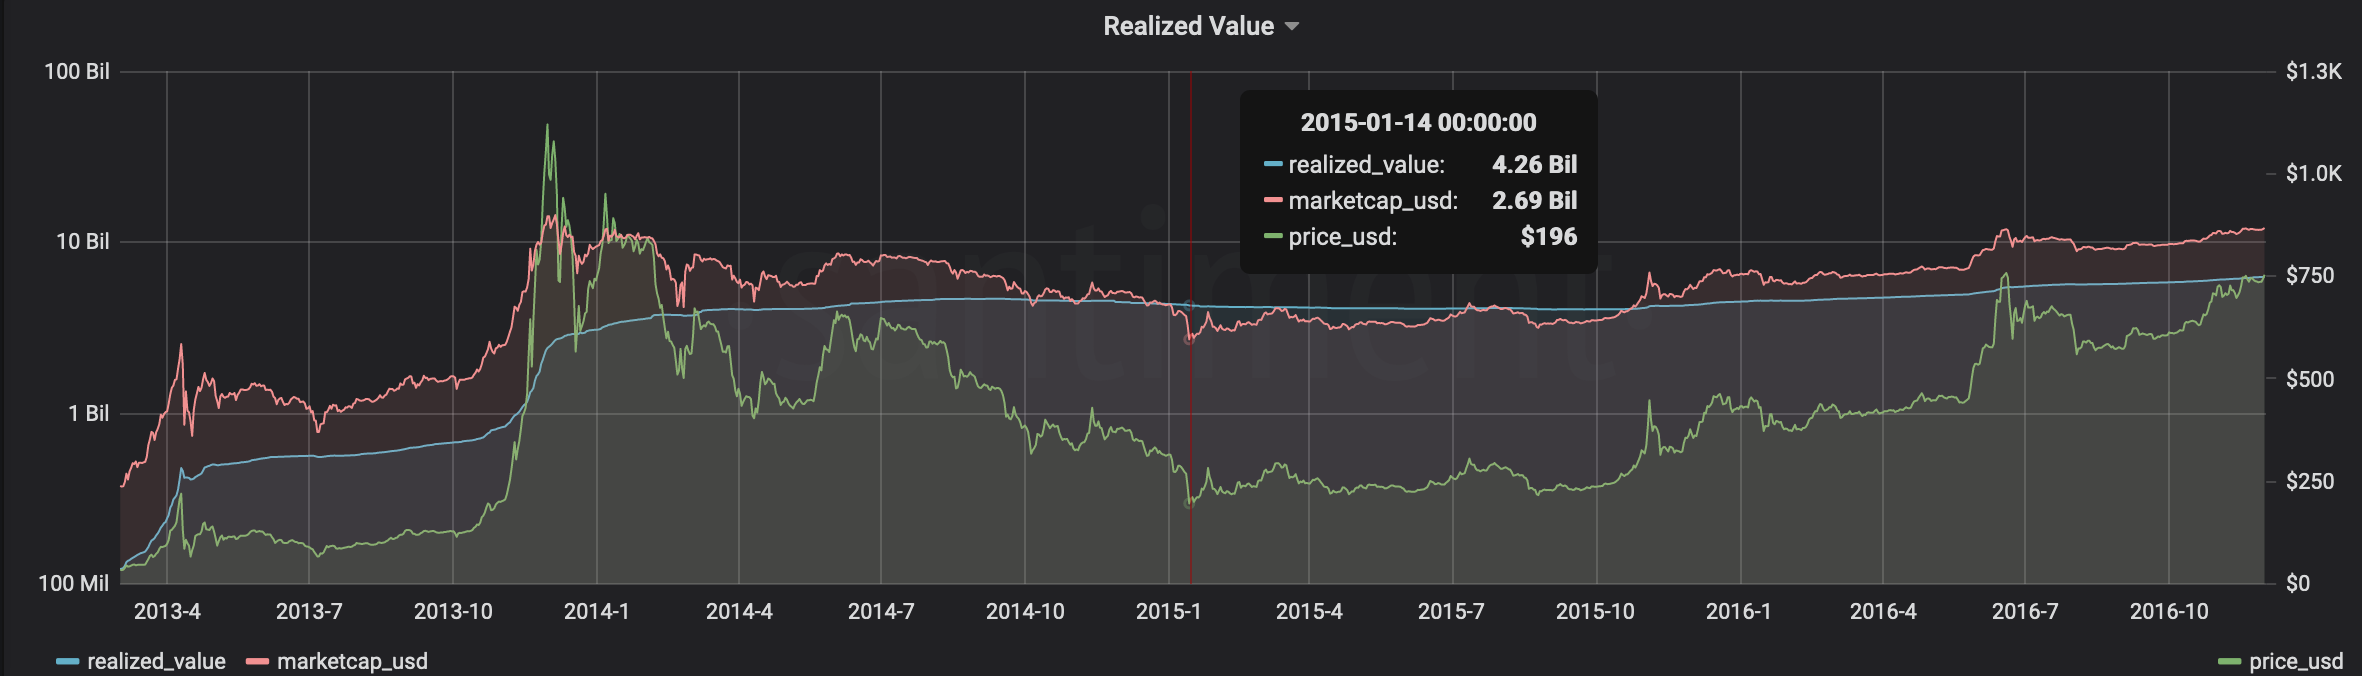

To briefly explain (although many here already know) , ‘Realized Value’ is determined by factoring the price each coin was purchased for, instead of the spot price which would be how ‘Market Cap’ is computed. The goal is to get an idea of how much money the current holders spent upon acquisition.
With this tool we can observe an interesting trend that is shared across the three largest corrections for Bitcoin. As each correction settled into its lowest range of consolidation, the ‘Market Cap’ and the ‘Realized value’ become inverted. During this period price action becomes the least volatile over time and Bitcoin pushes sideways. This persists until eventually, elevated interest in the asset increases and the value of the market capitalization rises above the realized value once again.
So there you have it, present market conditions have me believing that the time to grind and continue accumulating arrived months ago. But if I’ve failed to convince you that we have entered the low range please feel free to contact me and perhaps I’ll redirect you here, to Santiment. Or maybe I’ll point you in the direction of some very unique data (hint the location of said data is closer than you may think). Either way, feel free to reach out.
Addendum: After discussing this article early with a friend whose opinion I value greatly, I thought it worthwhile to clarify what I mean by a ranging market.
Consider BTC to be a car;
In 1st gear your cars engine can comfortably operate in a range of say 0-2500 RPMs (revolutions per minute) before you would need to shift up into 2nd gear in order to increase power and thus speed. I currently believe BTC is in 1st gear and we can consider the price action to be like Bitcoins RPMs. Now, depending on where the market drives we will likely remain in 1st gear for a little bit. That is, until we come to a hill and need to shift gears. Either way, the RPM range, or price range in this case, still offers a lot of room to trade. But I don't believe we will be racing any lambos just yet. We're probably better off racing a Skoda or a SEAT at the moment.
TLDR; A bunch of BTC moved recently, people talked about it a lot, for most of this year bulls and bears will argue over each others prophetic abilities. Zoom the fuck out, Bitcoin is ranging.
A very humble thank you to Tzanko Matev who kindly took the time to be sure I understood how ‘Realized Value’ is calculated.
Thanks for reading!
If you enjoyed this insight please leave a like, join discussion in the comments and share it with your friends!
Never miss a post from dindustries!
Get 'early bird' alerts for new insights from this author

Conversations (0)