Chainlink - Did the crowd capitulate before the rally?


Following a major sell-off between 24rd September and 26th September, Chainlink went on a 2 week rally going from $1.66 USD to $2.55 USD - A brutal punishment for those that sold too early.

Social volume
While the price action did see an increase in social volume to 470 total mentions, it is still significantly lower than the peak of 3,565 total mentions on June 29th.

Crowd reactions
- here comes resistance, but you already know how stupid you are shorting at 2.50
- Are the team still selling ?
- shorting LINK is suicidal lmao
- Chainlink is a pnd scam
- Link leading alt season 🚀
- Whats news on chainlink
- I think people are waiting for Swift partnership announcement
- It’s called a dead cat bounce
- Nope still in bear market until we pass 3. Charts don’t lie
Reactions are a little mixed, although looking at the conversations, it does appear that people are more cautious (less excitement than before) and in disbelief about the price action.
So, did the crowd capitulate during the sell-off?
The mixed emotions and disbelief observed above does make one wonder whether did the crowd sold too early? Let's take a look.
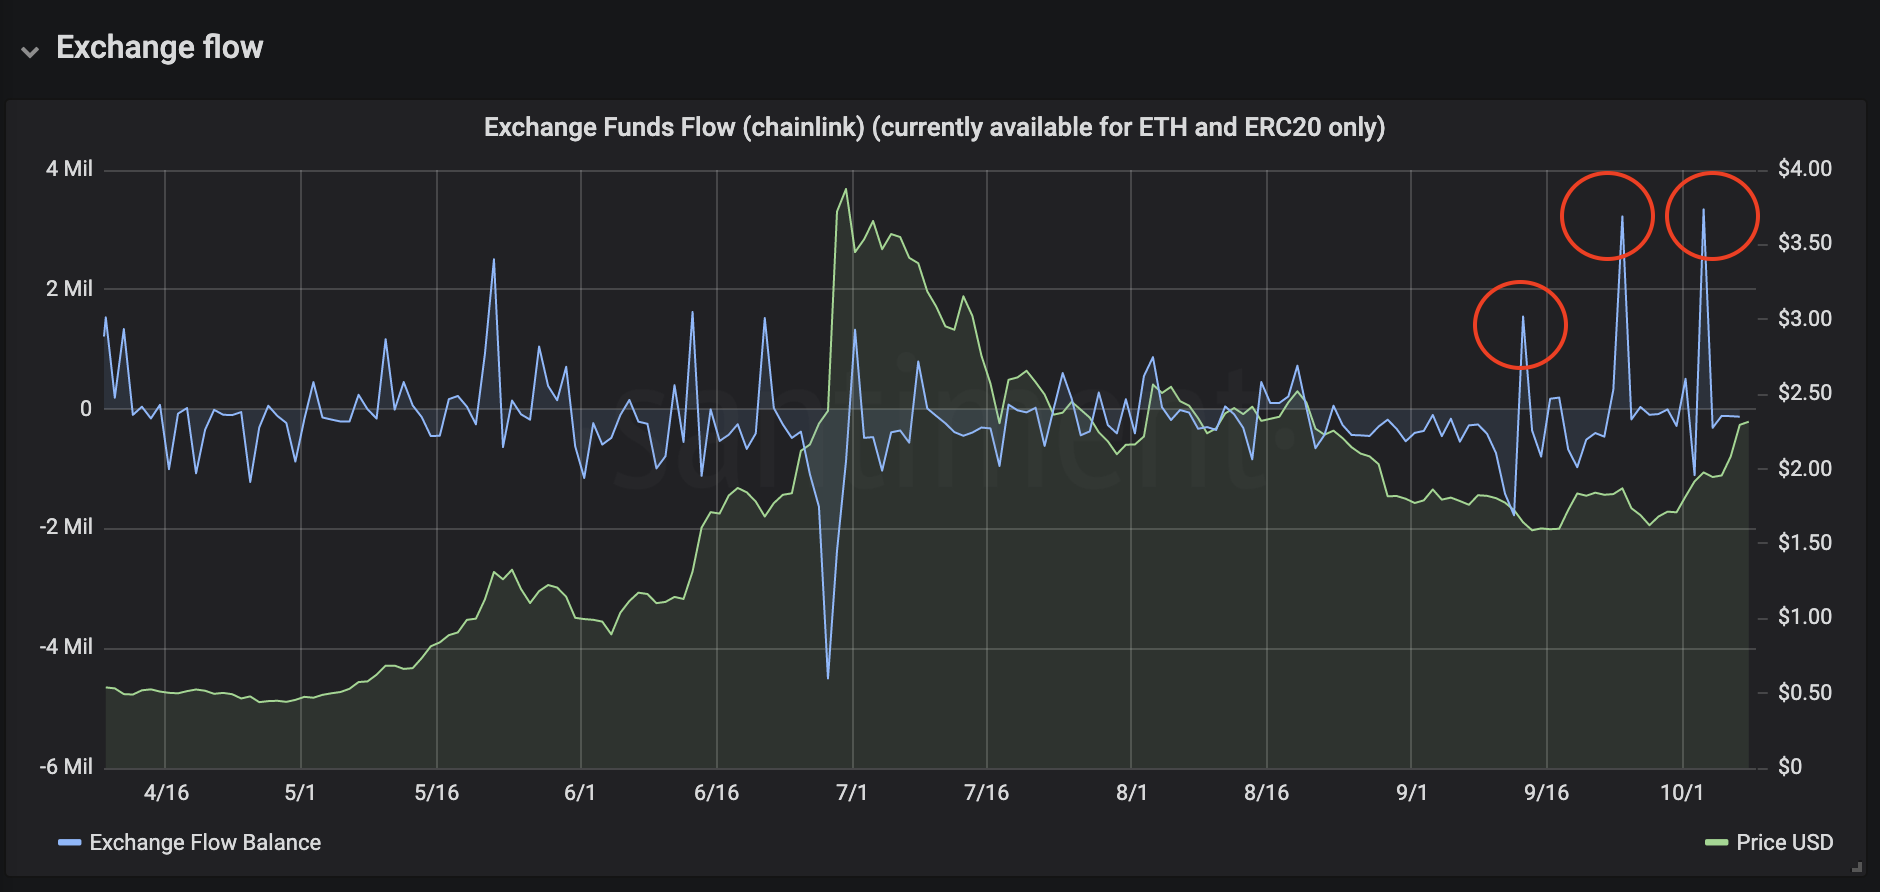
Exchange funds flow
Exchange flow did see spikes in net positive inflow to exchanges during that period and even recently, suggesting that people were looking to offload their stash. On September 24th, this inflow was followed by a downward price movement, no coincidence there.
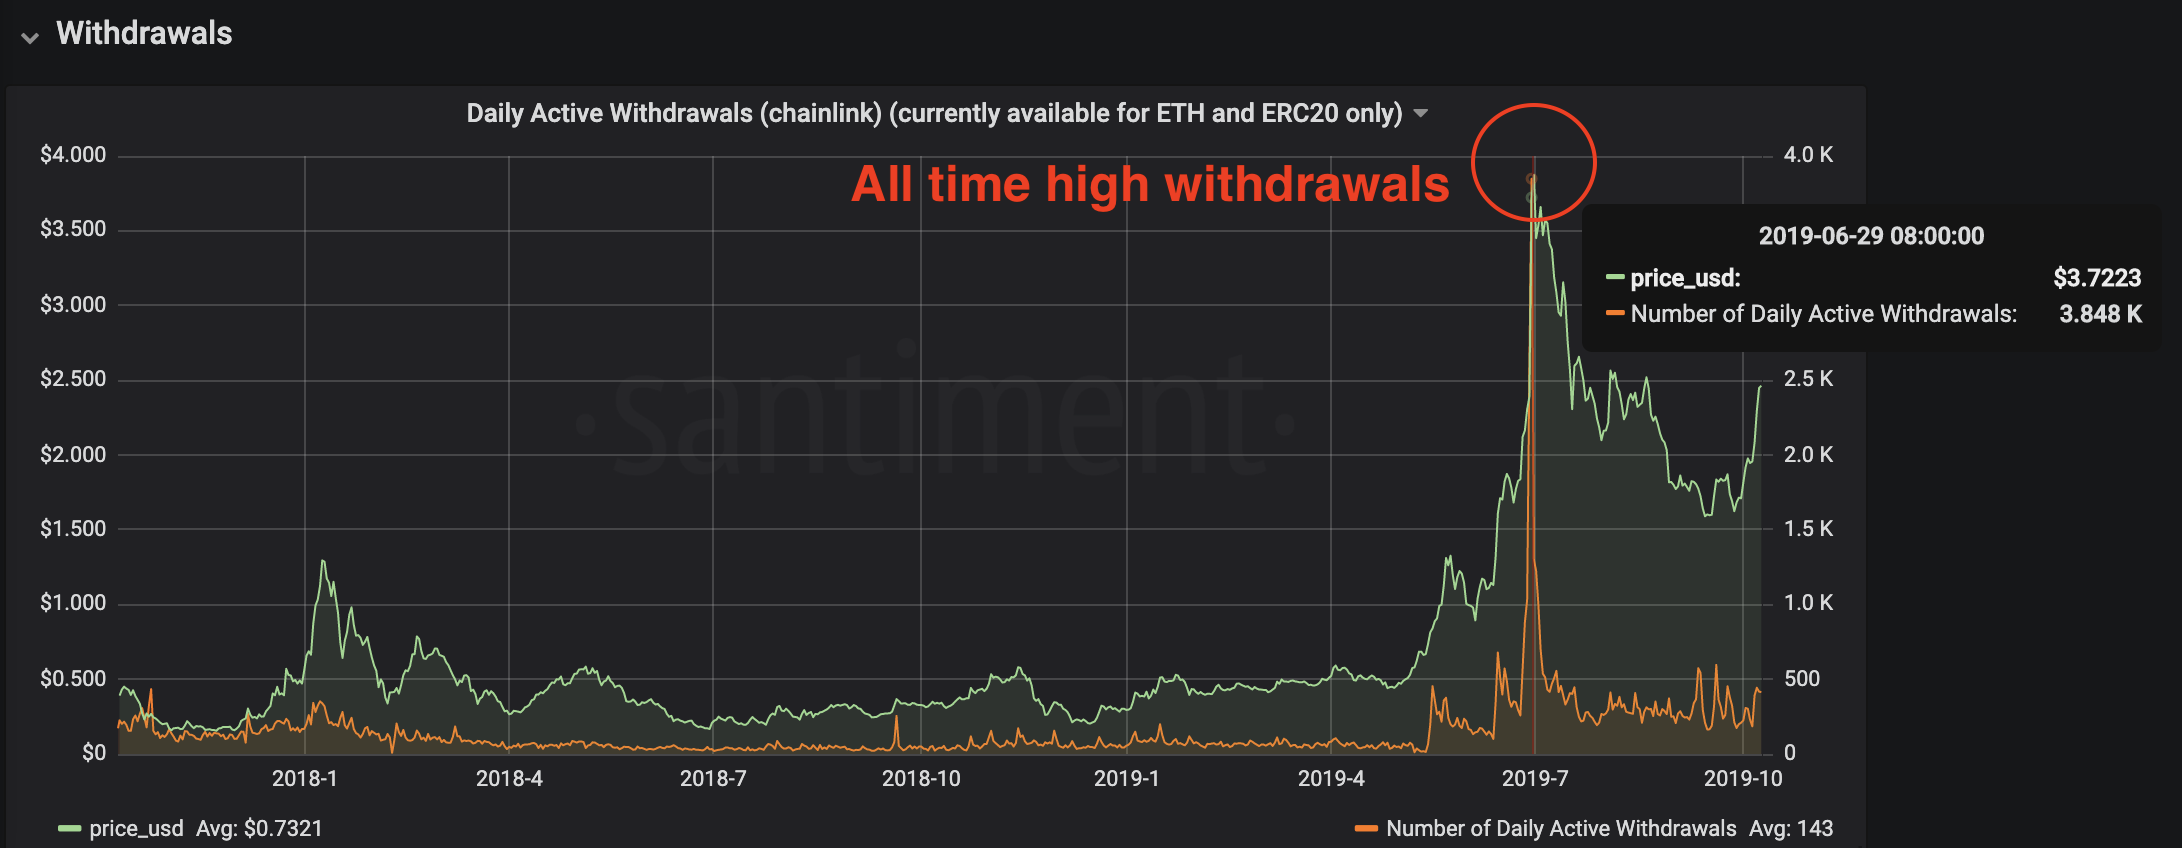
Daily active deposits/withdrawals & volume
Huge spike in Daily Active deposits is observed with over 2,500 active deposit addresses receiving LINK, making it the all time high deposit address activity.

Compare this to the all time high withdrawal address activity back when the price was at its peak. It's starting to look like those that bought high then are selling low now.
Let's determine whether it's the same folks that bought at ATH price that capitulated. Looking at averaged token age consumed which is a metric that shows the average number of days that the tokens were idle before being moved on a certain date, it reveals that.....
On the day of ATH Deposit address activity, tokens spent on averaged 11.9 weeks before moving on that day. Which means tokens prior to this, tokens were last moved around... you guessed it, when the price was around its ATH price in late June.

How much did the crowd deposit during the sell-off? Zooming in, we can see 4M++ LINK tokens were transferred to exchanges on 24th Sep and other large deposits over the next few days.

Growth & HODLERS remain strong
Number of holders by number of owned coins
Despite the massive fall in price and short-term crowd exodus, the amount of Chainlink holders continue to increase. Going from 44,000+ addresses at the price peak (late June) to 65,500+ addresses today.
The exodus of holders during the sell-off in late September can be observed in the dip in the graph below. This dip in holders is mainly from holders (few thousand addresses) that owns between 1,000 - 10,000 tokens.

Top holders
Meanwhile, Top LINK holders continue to HODL for the most part, with a few of them adding on to their stacks in the past 28 days. Talk about strong hands!

Now that the short-term speculative crowd is gone, perhaps we might just see LINK resume its journey and continue to leave many in disbelief. That said, it's not immune to overbought conditions/corrections and macro factors along the way.
Will be keeping a close eye on on-chain/social metrics to see how market participants are behaving. Interested? You too can access the metrics used in this insight by requesting a trial to SANgraphs.
Thanks for reading!
If you enjoyed this insight please leave a like, join discussion in the comments and share it with your friends!
Never miss a post from Sanfam!
Get 'early bird' alerts for new insights from this author

Conversations (0)