Can LINK repeat its February push? (On-chain analysis)

It’s been a fairly disappointing month for Chainlink’s native token (LINK), which is down -22.5% since hitting a new price ATH, despite a few major price-moving announcements as of late.
And with Theta’s massive rally 'threatening' to knock LINK out of the top 10, let’s take a closer look at the third biggest ERC-20 coin, and what its on-chain activity may suggest about things to come.
When it comes to holder confidence levels, LINK’s on-chain data points to an ongoing reduction in sell-side pressure and the prevalence of ‘strong hands’ for the time being. The amount of daily deposits - addresses used to funnel LINK to exchanges - has been in a decline since the March 3rd price top, sitting at 9-month low 319 at the time of writing:

As the main
There’s more of this Insight
Choose your subscription plan
Years of market experience, compressed in each report
Since 2017, Santiment has been an industry leader in on-chain data, social intelligence and behavior-based analysis of the crypto market.
Our tools have a proven track record of timing price tops for cryptocurrencies, helping traders find profitable exit points and mitigate HODLing risk.
Our previous TOP calls:
What you get with Sanbase Pro:
- Members-only daily market insights and analysis
- 30+ on-chain, social & project indicators for 900 cryptocurrencies
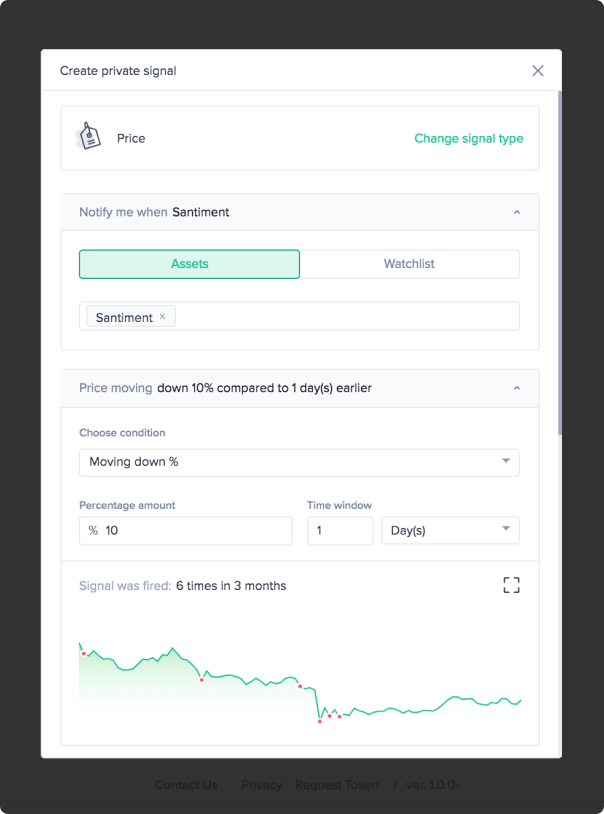
- Custom alerts for the coins' price, on-chain & social trends
- Santiment Spreadsheet plugin with 10+ pre-made market templates
- Personalized asset watchlists and weekly performance reports
Gain unfair advantage with Sanbase Pro
Subscribe to Sanbase Pro for access to exclusive insights, market-beating metrics, strategies and templates!