Bold Predictions XXIII - Invasion of the Altcoins... Will it Last?

SANBASE SIGNALS
November 24, 2020
In the past 30 days, Bitcoin jumped from $12,900 to a peak of $18,900 this past weekend. This ~+47% stretch was the largest price gain for the #1 crypto asset since December, 2017. Interestingly, for the vast majority of this stretch, altcoins were lagging slightly behind. However, over the past week, this narrative has changed. The Ripple Army has come out in masses as the past week saw a monumental +134% price skyrocket.

And Ripple hasn't been the only altcoin that has broken out in a big way. As we very often see in the case of a Bitcoin-dominant price burst, profits very often funnel into altcoins as traders begin to get euphoric about the crypto markets again. This is eerily similar to the spring of 2017 when Bitcoin's price jumped from $1,300 to $2,200 from April to May, followed by an Ethereum and altcoin explosion that ended up lasting for the greater part of the entire rest of the year. By no means are we claiming that this is what we're in store for, but these sustained rallies by Bitcoin, followed by its price dormancy as altcoins become the volatile assets, is a pattern we've seen all too often in cryptocurrency's cyclical nature. Find out what below what the realistic scenarios should look like heading into December!
We continue to offer 25% off your first month's subscription on any Santiment service you have your eye on! Just take 15 seconds to provide feedback for us on this poll. Then just visit the Sanbase pricing page to get started with your 25% discount now, and enter SIGNALS25 at checkout! Any help needed on redeeming this, just email us at [email protected].
With every weekly volume we release of our Bold Predictions series, we are taking a look at the most recent previous days of our metrics to assess what divergences may be forming to imply future market movement. None of our assessments should be considered investment advice, and we encourage you to explore Santiment's metrics for yourself to formulate your own opinions based on your own trading strategies.
As a reminder, these signals are for traders to assess local tops and bottoms based on historically predictive and backtested leading indicators. Our rating system is simplified on a 0 to 10 scale, with 0 being as bearish as possible and 10 being as bullish as possible. This would mean that a 5 would be neutral and imply sideways movement estimates over the next couple weeks until the next edition. Whether we call a project bullish or bearish for the next week or two, please remember that this has no relevance as to what we think of the asset's long-term viability as an investment.
----------------------------------------------------------------------------------
This Week’s Assets:
- BTC, ETH, XRP, LINK
This Week’s Metric Breakdowns:
- DAA vs. Price Divergence
- MVRV
- NVT Token Circulation
- Weighted Social Sentiment
----------------------------------------------------------------------------------
Bitcoin ($BTC) - #1 Ranked Market Cap
- 7-Day Movement: +7.1%
- 30-Day Movement: +44.6%
- 90-Day Movement: +64.1%
DAA vs. Price Divergence (Long-Term Deviation)

Based on our DAA Divergence model, it may just look like things are just entirely broken. But our DAA Divergence model really can accurately assess when things are overheated and predict where prices are heading, given enough time. And yes, this has been showing historically large red bars for quite some time. Does it mean the rally is about to come to a halt? Not necessarily. But with address activity mostly staying flat over the past month despite this incredible Bitcoin price surge, the only two scenarios that can occur to even out this model are:
- Bitcoin's unique address interacting on the network catches up with price due to retail traders and FOMO
- Bitcoin's price gradually drops or falls off a cliff to correct for the all-time low bearish gap between price and daily active addresses
Our DAA Divergence model is available for anyone with a Sanbase PRO account: https://docs.google.com/spreadsheets/d/1opTpz2lDBXd9o6izMoUHzTWEU-pw-UAD2CuI-s4BWoA/view
Rating: 0.0
MVRV Opportunity/Danger Zones
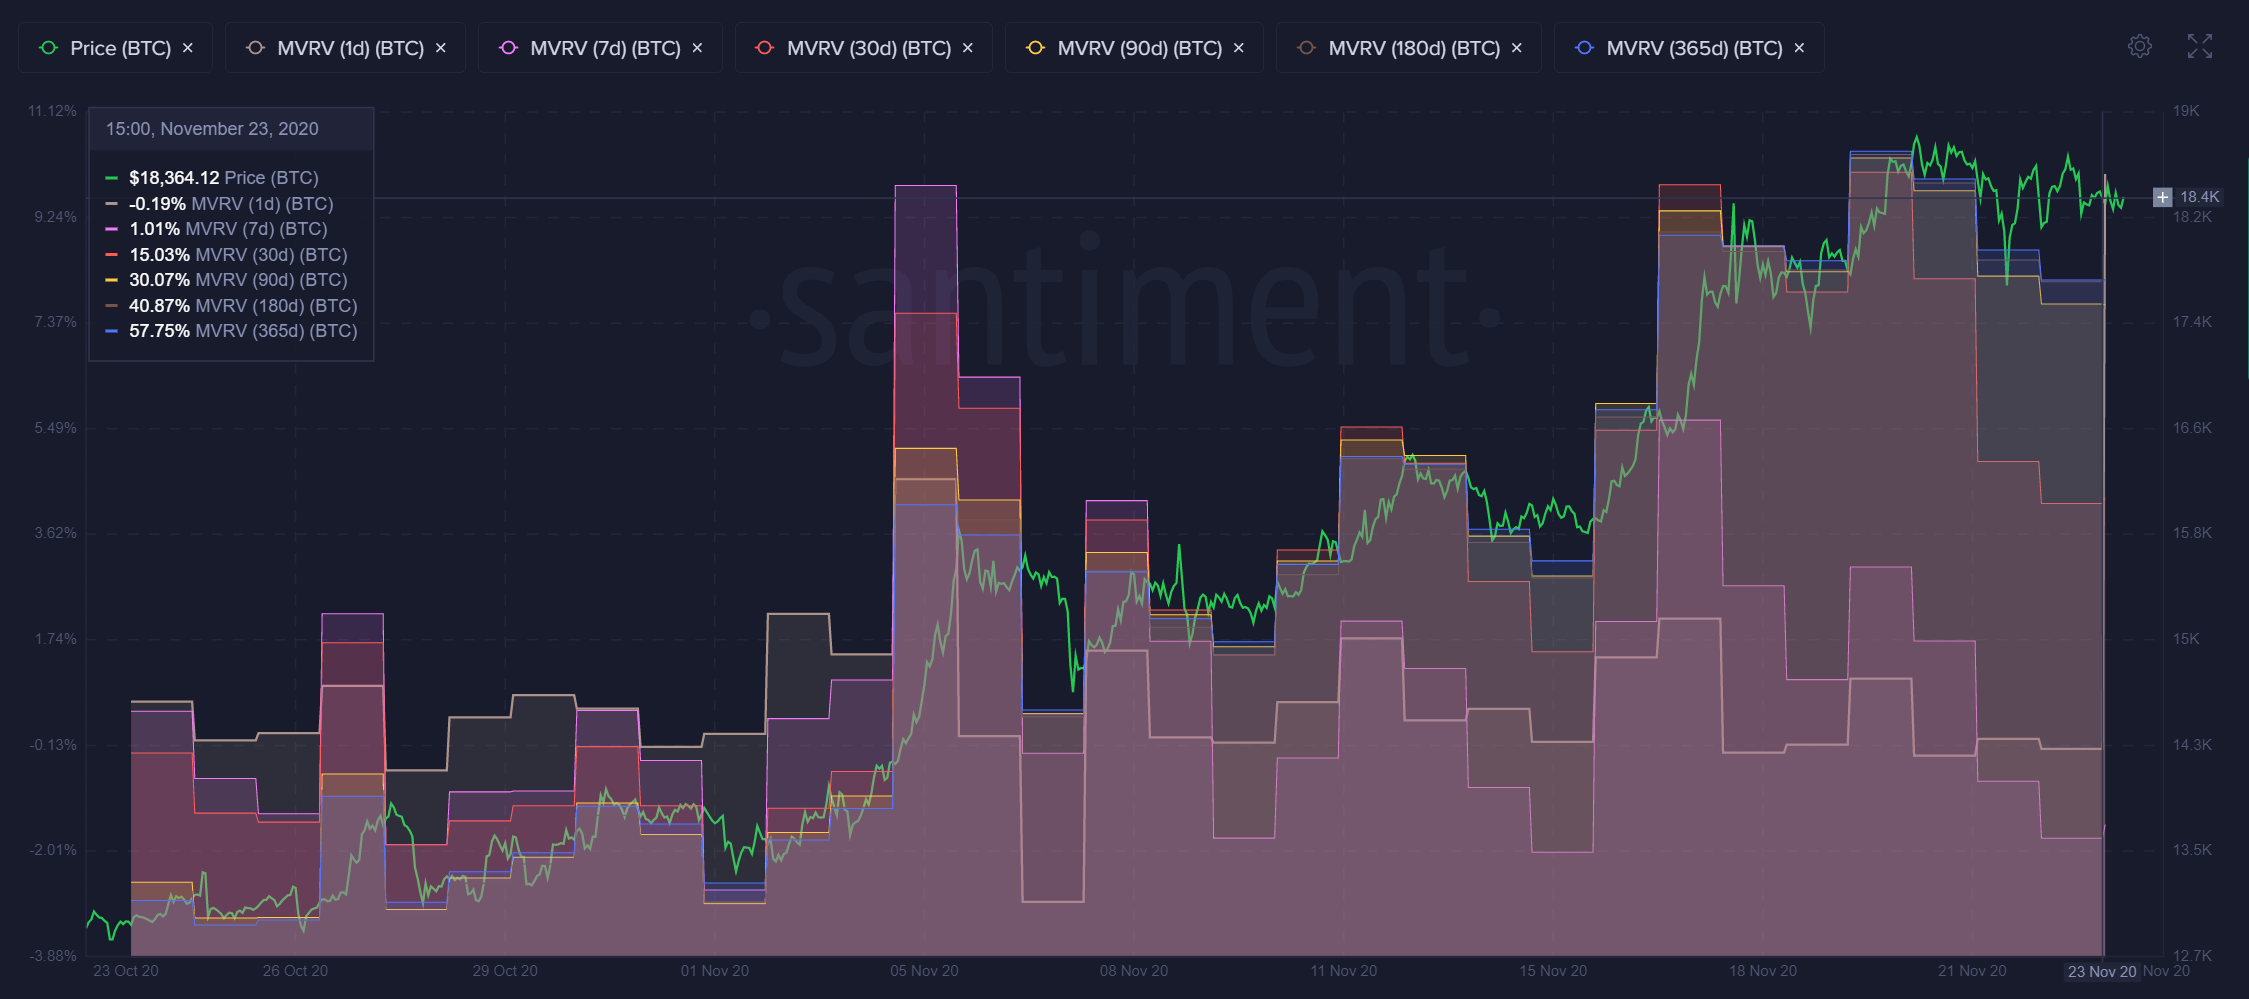
Bitcoin has, at least for the time being, flattened out and settled in at the $18.4k - $18.6k range. You'll notice that the MVRV's for each of our timeframe average returns, they are well above positive. The only exception is the one-day, which is right at about even returns for traders at -0.19%. Regardless, our Danger/Opportunity Zone MVRV model is indicating that the returns are about 2/3rds of the way to the absolute danger zone, indicating a high likelihood of a correction. We will need a sustained dormant period where price stays at these levels in order for the 30d and 90d MVRV's, at minimum, to get back to a healthy level and imply low-risk buy opportunities again. Plug in your PRO API key to check our model: https://docs.google.com/spreadsheets/d/1wYTvxKYNYry_pJ-RB4kzbpVF60c26RlTfkMla05jG34/edit?usp=sharing
Rating: 2.0
NVT Token Circulation

If there is one clear on-chain reason for why Bitcoin was able to take liftoff beginning in October, the answer would undoubtedly have to be token circulation. The amount of unique tokens exchanging locations and jumping from wallet to wallet, has taken liftoff. And with the rise in previously dormant coins being moved, we're seeing the #1 market cap asset in crypto be able to rise at rates not seen since 2017. The weekend cooled off circulation slightly, as can be seen by these hashmarks above the average for November (furthest right green bar). But we're still well into semi-bullish territory, according to one of our strongest leading price models: https://docs.google.com/spreadsheets/d/1CpPBVgJJ-6T5EIKHkeMKBG954Rp5HlEHtevSzXOns1Y/view
Rating: 7.0
Weighted Social Sentiment

Yes, Bitcoin has expectedly become a very positively regarded subject on Twitter and other social platforms again. The weighted sentiment, according to our algorithm, peaked at the highest positivity level Twitter has been in since June. Over the past 24 hours though, it does look like there are some cynics assuming that the recent $18.9k level BTC hit this weekend, was the local top. Regardless, the crowd is still quite positive currently, and we consider this to be confidently bearish territory based on history.
Rating: 3.0
BTC Average Rating: 3.0 (Bearish)
----------------------------------------------------------------------------------
Ethereum ($ETH) - #2 Ranked Market Cap
- 7-Day Movement: +27.6%
- 30-Day Movement: +50.8%
- 90-Day Movement: +58.6%
DAA vs. Price Divergence (Long-Term Deviation)

Ethereum bulls are rejoicing at the recent price cross above $600 for the first time in 30 months. However, this isn't coming in unison with the most encouraging address activity on the ETH network. As the #2 coin crossed above this celebrated price barrier, our DAA Divergence model indicated the most bearish single day between price and address activity in about 70 days. For this reason, combined with the sustained bearish prices, we have to advise serious caution here.
Rating: 1.0
MVRV Opportunity/Danger Zones

The average returns for Ethereum holders look even higher than Bitcoin's for all six of these average trader return timeframes. This is quite surprising considering Bitcoin has outperformed on longer Ethereum on some longer term time scales. This being said, you don't want to see sky-high MVRV's for all timeframes, as traditionally these are pretty clear local top spots.
Rating: 0.5
NVT Token Circulation

Tokens continue to be moved at a very healthy rate on the ETH network. And this is a great thing to see when other metrics are showing such caution flags. The asset is continuing to see enormous circulation days, with the last three days being some of the best performers of the month (unlike BTC). So we don't see much slowing down in terms of tokens shuffling around.
Rating: 9.0
Weighted Social Sentiment

Weighted social sentiment continues to be positive for Ethereum, but not overwhelmingly so. This is actually a good thing, as it's indicative that FOMO hasn't quite taken a hold of the asset yet. Meaning there could still be a bit of room to climb before euphoric feelings of everyone getting lambos begin to take effect and cause an inevitable correction. Even, still, a bit more positive than we'd like.
Rating: 3.0
ETH Average Rating: 3.4 (Slightly Bearish/Bearish)
----------------------------------------------------------------------------------
Ripple ($XRP) - #3 Ranked Market Cap
- 7-Day Movement: +108.7%
- 30-Day Movement: +158.9%
- 90-Day Movement: +127.5%
DAA vs. Price Divergence (Long-Term Deviation)
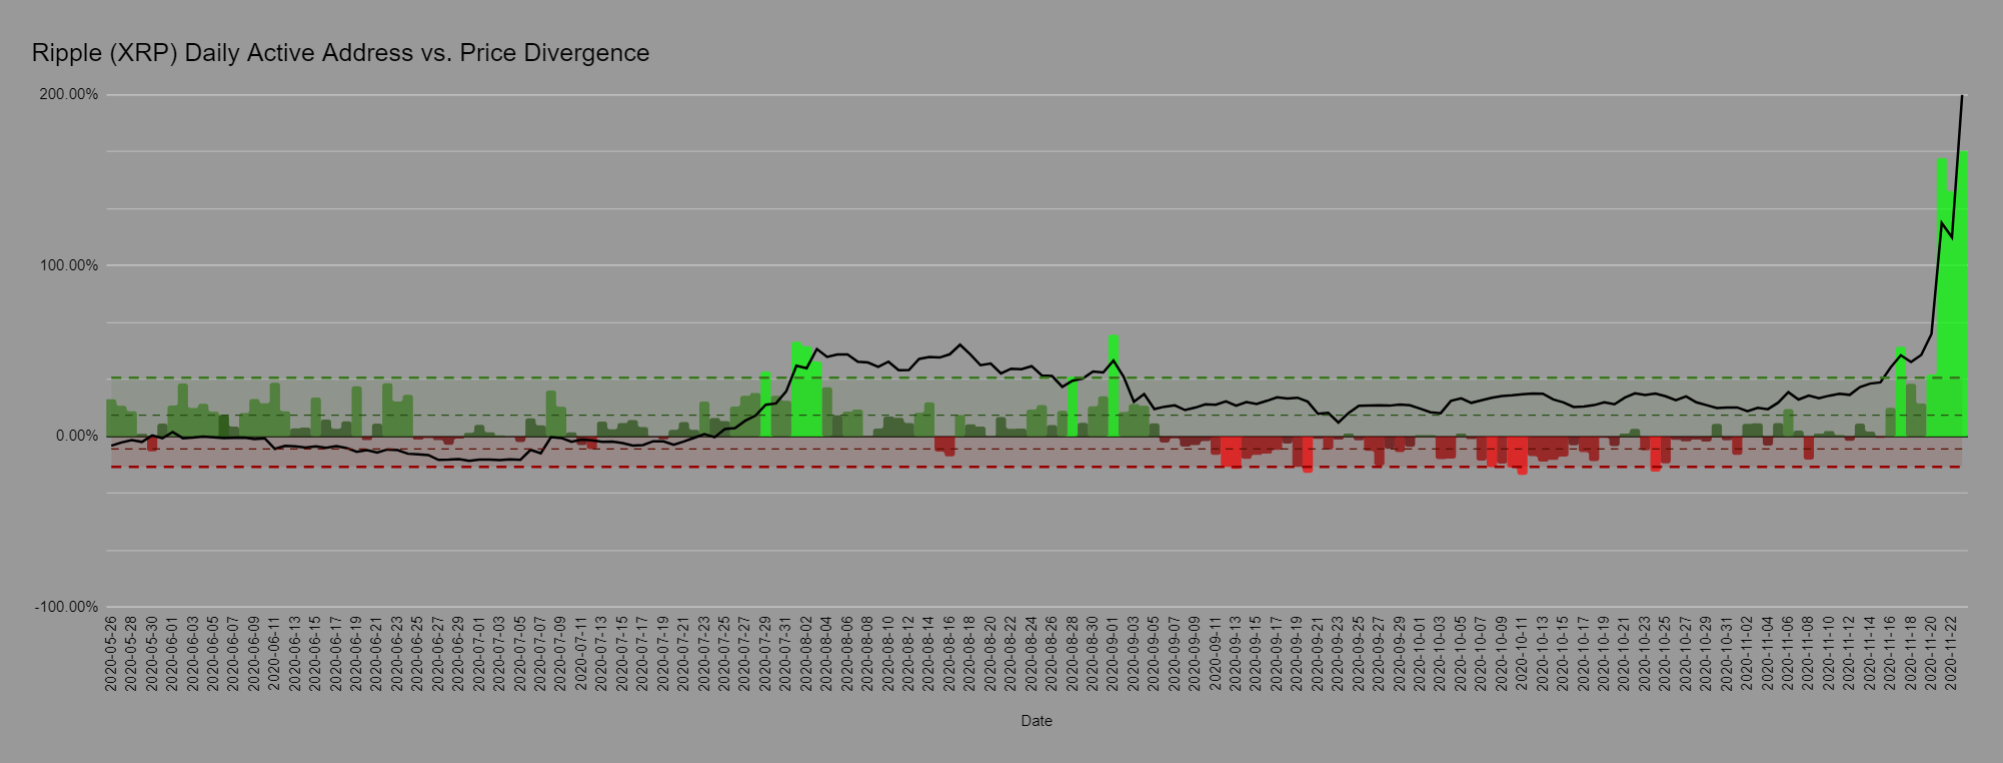
Yes, these are real bullish divergences that have occurred in the past three days for Ripple. Daily active addresses are at their highest levels for Ripple that we've seen in 2020. And the only concern is the fact that there wasn't really any room between these active address spikes, and the timing of XRP's price to catch up with it. We have a feeling these three days were anomalies and it will come back to earth along with price fairly quickly, but this is still a solid sign that has to be given a bullish rating.
Rating: 7.0
MVRV Opportunity/Danger Zones

Yes, Ripple's average trader returns are through the roof amongst every single timeframe currently. The 30-day investors are up +159% on average in the past month alone. And when an asset is gaining over +5% returns per day for an entire month, history says there will be a period that will allow traders to catch their breaths at best, and kick themselves for not selling at worst.
Rating: 0.0
NVT Token Circulation
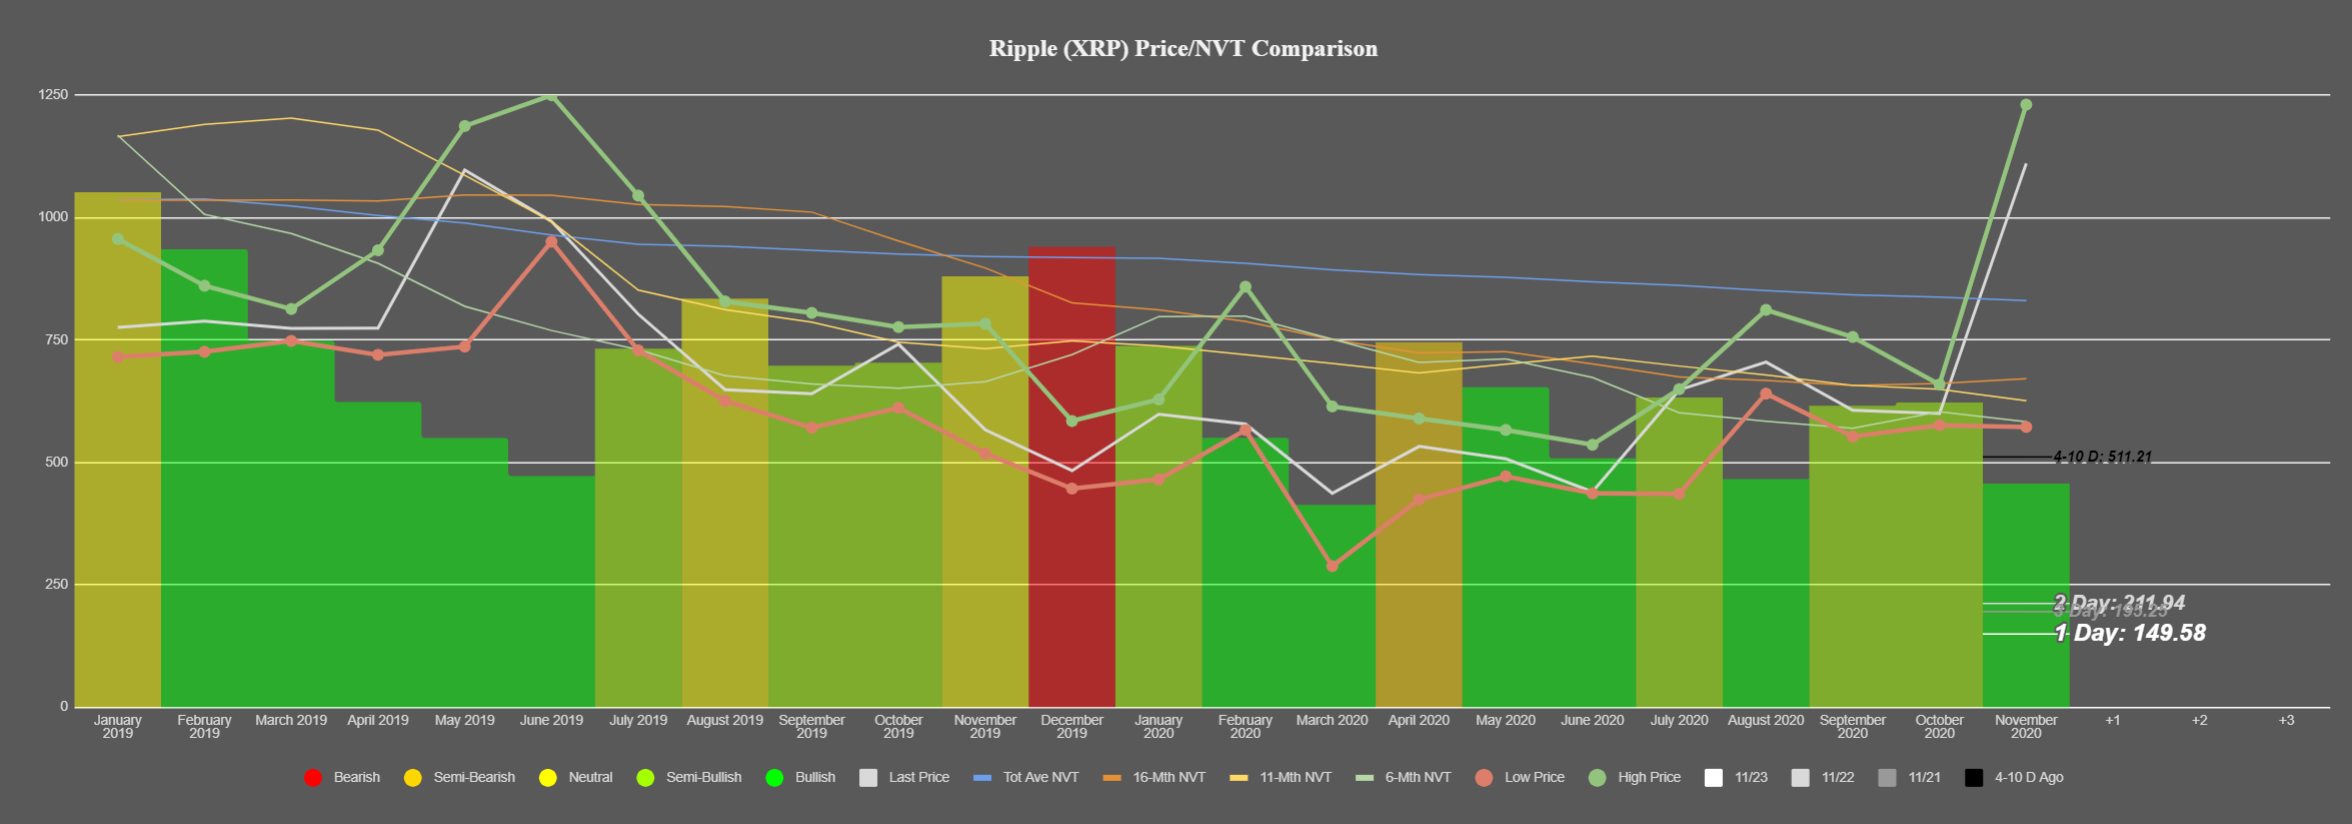
Ripple is enjoying its best token circulation ratio since March, and the last few days have been enormous token circulation days. It makes sense that there's a ton of FOMO going on when the asset is in the midst of a +109% week. As we saw with the DAA model above, the amount of addresses interacting on the XRP network has shot through the roof. So seeing individual tokens moving at an increasing rate is a great sign for bulls.
Rating: 7.0
Weighted Social Sentiment

Ripple is seeing a major positive bias right now, according to Twitter posters and commenters. The last time the XRP army was this positive was the beginning of October. And mostly due to Bitcoin's surge, Ripple and the rest of the altcoin pack did climb afterward. But not for long. Generally, these major sentiment spikes on the positive side lead to an eventual local top. And there's a high likelihood that this could come to fruition in the near future, in order to neutralize the euphoria happening around the #3 crypto asset by market cap.
Rating: 1.0
XRP Average Rating: 3.8 (Slightly Bearish)
----------------------------------------------------------------------------------
Chainlink ($LINK) - #6 Ranked Market Cap
- 7-Day Movement: +18.7%
- 30-Day Movement: +29.7%
- 90-Day Movement: +3.4%
DAA vs. Price Divergence (Long-Term Deviation)

It may not look like much due to the dwarfing giant bullish divergences that occured back in August's epic Chainlink rise. But DAA has been climbing quite well as LINK returned to north of $15. This is a small, but noticeably bullish divergence that should keep the ball rolling for LINK as long as Bitcoin can stay afloat.
Rating: 6.5
MVRV Opportunity/Danger Zones

LINK's MVRV returns are up across the board, but a bit more modestly than the absolute nosebleed numbers we see with XRP. That being said, these are still sky-high numbers. The +64% in the last year still will have to neutralize eventually. But this is one of the higher return assets for average traders. This explains a lot about why it's such a positively regarded token, considering there are almost no assets that compare to it in terms of average trader returns. And yes, this means you should be extra cautious when numbers are so high on a metric that hovers around 0% by design.
Rating: 1.5
NVT Token Circulation

Chainlink's token circulation compared to its market cap has been consistently amazing compared to its historical levels, essentially since February. This has played a large part in its ability to be one of the large cap price return leaders in 2020. Barring a shocking dropoff in unique tokens transacting in LINK's network, this will be the 10th straight month of a solid bullish divergence on our NVT model.
Rating: 8.0
Weighted Social Sentiment

The mood surrounding Chainlink on Twitter has turned positive over the past couple weeks, but not by an overwhelming margin. There are some very wild swings in euphoria that lead to local tops for the ETH-based project that garners so much social media attention. Look for a crossover above 2.0 on this chart (available for PRO members) as an obvious time to capitalize on an upcoming local top.
Rating: 3.5
LINK Average Rating: 4.9 (Neutral)
----------------------------------------------------------------------------------
Thanks for reading!
If you enjoyed this insight please leave a like, join discussion in the comments and share it with your friends!
Never miss a post from brianq!
Get 'early bird' alerts for new insights from this author

Conversations (0)