Bold Predictions Volume VII - Hello $10K, My Old Fr... Aaaaand It's Gone.

SANBASE SIGNALS
June 2, 2020
It's fair to say that June kicked off with a bang, followed by many FOMO'ers buying in above $10,000 proceeding to get bull trapped. Now with Bitcoin sitting at $9,500, it appears uncertainty is rising after a second move above five-figure prices followed by a quick retrace, in the past 30 days. As always with these Bold Predictions weekly articles, we aim to measure the network health of BTC and other relevant projects to find out how fundamentally healthy their networks seem to be.
As always, we continue to offer 10% off your first month's subscription on any Santiment subscription you have your eye on! Just take 15 seconds to provide feedback for us on this poll. Then just visit the Sanbase pricing page to get started with your discount now, and enter SIGNALS at checkout! Any help needed on redeeming this, just email us at [email protected].
With every weekly volume we release of our Bold Predictions series, we are taking a look at the most recent three-day averages (or percent changes) for each metric we're covering. As a reminder, these signals are for intra-day traders to assess local tops and bottoms based on historically solid leading indicators.
Our rating system is simplified for this week. A 0 to 10 scale, with 0 being as bearish as possible and 10 being as bullish as possible. This would mean that a 5 would be neutral and imply sideways movement estimates over the next week. Whether we call a project bullish or bearish for the next week or two, please remember that this has no relevance to what we think of the asset's long-term viability as an investment.
----------------------------------------------------------------------------------
This Week’s Assets:
- BTC, ETH, BNT, LINK, MKR
This Week’s Metric Breakdowns:
- Price/Volume Momentum, DAA vs. Price Divergence, NVT
----------------------------------------------------------------------------------
Bitcoin ($BTC) - #1 Ranked Market Cap
Price/Volume Momentum
- 3-Day Movement: +1.6%
- 30-Day Movement: +7.8%
- 90-Day Movement: +5.9%

Yesterday, the word "BART" was trending, and after some admitted confusion, I discovered that the squared off top we saw in Bitcoin's price to kick off June was to blame. However, despite BTC making an odd jump from $9,500 to $10,100, and then back to $9,500, we did see an uptick in trading volume. So for those who feel we are right back to where we are sitting in late May, keep in mind that this is a slightly more optimistic looking chart. The overall trend in volume over the past 30 days is down, but the short term is up. Meanwhile, the 30-day price trend is still in an upswing. We will rate this just slightly bullish.
Rating: 6.0
Daily Active Addresses vs. Price Divergence

A sea of red, slightly bearish signals continue to dominate our DAA vs. Price Divergence model for Bitcoin. After backtesting, we consider 0.29 to be the threshold of significance for the #1 market cap coin, and surprisingly in spite of all of these slightly bearish signals, this model indicates we've only crossed this barrier once. It is still concerning that we are mostly overinflated in price compared to the network's output of daily active addresses... but it's slightly less concerning that things look in our above screenshot.
Rating: 2.5
NVT

Bitcoin's token circulation heading into June continues to look strong, and we've seen an improvement on the encouraging May semi-bullish divergence that we saw. It's important to remember that this model is most effective during flat markets, as it can accurately indicate when there should be a price move in either direction while volatility waves are relatively small. So keep in mind that some of this high token circulation can be attributed to the sudden drop we saw back down to $9,500 to kick off June.
Rating: 8.5
BTC Average Rating: 5.7 (Neutral/Slightly Bullish)
----------------------------------------------------------------------------------
Ethereum ($ETH) - #2 Ranked Market Cap
Price/Volume Momentum
- 3-Day Movement: +3.8%
- 30-Day Movement: +15.1%
- 90-Day Movement: +4.5%

Ethereum had a serious rise last week, as it nearly scraped $240 during a solid week for altcoins. We can see how volume stayed fairly flat as the price rose to its monthly high, which was a good foreshadow for prices topping out. And right now it appears that volume has lost most of its momentum. Trading was higher at the beginning of May than it appears to be to pick off June, so we're a bit concerned that the short-term volume jump has appeared to have fizzled out.
Rating: 3.5
Daily Active Addresses vs. Price Divergence

Ethereum's Daily Active Address vs. Price Divergence model is mostly giving very modest divergence signals. The threshold of significance is 0.5, and this has not been crossed once in the bullish or bearish direction over the past 30 days. That being said, this timeframe has mostly revealed a very slightly bullish trend, which indicates a slight deficit in unique addresses transacting on the ETH network. It's a minor concern for now.
Rating: 4.0
NVT

ETH's NVT looks solid for a second straight month thus far, and overall we haven't seen any long-term bearish signals since January (even with the occurrence of Black Thursday in mid-March). The consistently high amount of unique tokens being circulated in 2020 has contributed to Ethereum being able to gradually recover back to the mid-$200's after closing each month below $235 since June, 2019. And looking at the short-term token circulation of NVT, it's continuing to look impressive, with yesterday in particular having a very high output. We are very encouraged by the start of June, and 3 of the 4 past months revealing bullish divergences.
Rating: 9.0
ETH Average Rating: 5.5 (Neutral)
----------------------------------------------------------------------------------
Bancor (BNT) - #116 Ranked Market Cap
Price/Volume Momentum
- 3-Day Movement: -2.9%
- 30-Day Movement: +198.1%
- 90-Day Movement: +103.5%

Bancor is showing classic signs of a local top, according to its trading volume alone. Maintained flat prices coinciding with declining volume is what you don't want to say when longing an asset, and it's indicative of the bullish rally starting to die down. Particularly over the past day, as we saw a dropoff in BNT along with the rest of the markets, prices made a very modest bounce that was not supported by volume. This is typically the type of chart we can look at and immediately try to look for better options.
Rating: 1.5
Daily Active Addresses vs. Price Divergence

Supporting what we see in the price/volume chart, BNT's, DAA vs. Price Divergence has shown wild swings in both directions over the past 30 days. As of late we've seen our biggest bearish divergences over this timespan. They aren't excessively large divergences, but they are large enough to invoke concern.
Rating: 2.5
NVT

Bancor's unique tokens being moved on the network, however, looks encouraging. It's a bit too difficult to judge the extremely bullish looking NVT we have seen to kick off June, but we have seen three straight months of high token circulation activity compared to BNT's long-term average. After a great April and May, it's tough to presume the trendlines on this chart won't catch up with the monthly NVT outputs of Bancor eventually, but for now this model still looks great for the 116th ranked market cap coin.
Rating: 9.0
BNT Average Rating: 4.3 (Neutral/Slightly Bearish)
-------------------------------------------------------------------
Chainlink (LINK) - #14 Ranked Market Cap
Price/Volume Momentum
- 3-Day Movement: +7.5%
- 30-Day Movement: +17.9%
- 90-Day Movement: -5.9%
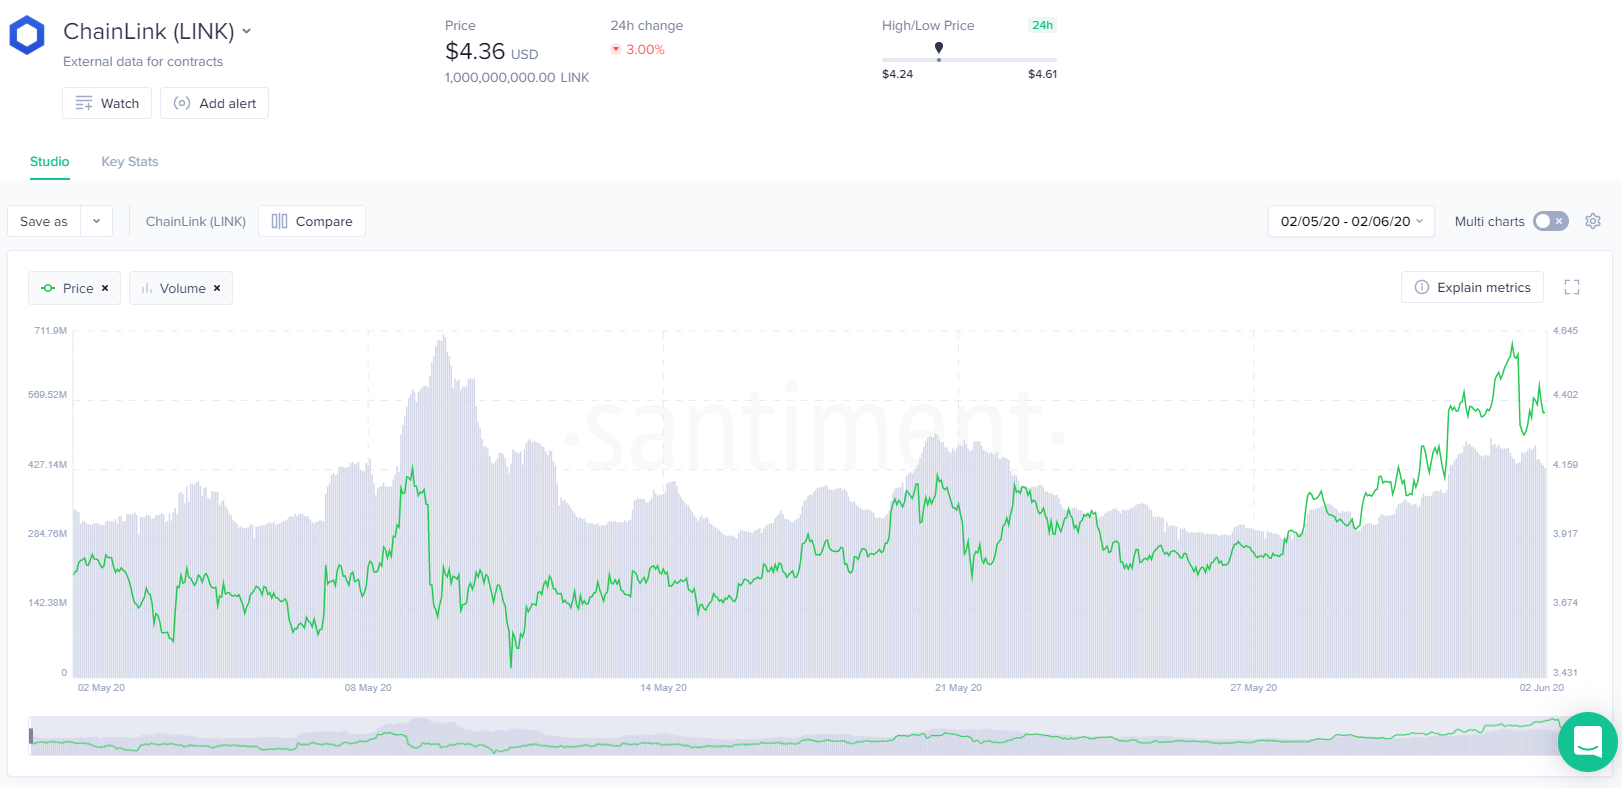
Chainlink, unlike some of the other assets discussed above, appears to have actually gotten a significant rise in volume at the end of May that hasn't really fallen off into June. The 30-day trend also shows a slight uptrend, while BTC and ETH show a clear mild downswing occuring. So as you might guess, this is encouraging and foreshadowing that a decoupled rise could be in LINK's future in the next couple of weeks. Watch volume carefully to see if things maintain these levels, or if they start to decline to match the rest of the markets.
Rating: 7.5
Daily Active Addresses vs. Price Divergence

Modest bearish divergence signals have popped up for LINK over the past week on our DAA vs. Price Divergence model. Thus far, the price has ignored them, but we wouldn't be surprised if things correct just slightly. And if they don't, it will be because DAA has caught up to the continually rising price for one of the more highly discussed projects of 2020.
Rating: 7.0
NVT

Chainlink's NVT has been en fuego since February, and June is continuing to show solid output for token circulation. Five straight months of a bullish divergence for this NVT model is about as good as you can ask for among top 100 blockchain projects, so there is no real reason to criticize LINK's continually impressive token circulation NVT.
Rating: 9.5
LINK Average Rating: 8.0 (Bullish)
----------------------------------------------------------------------------------
Maker (MKR) - #33 Ranked Market Cap
Price/Volume Momentum
- 3-Day Movement: -8.3%
- 30-Day Movement: +21.1%
- 90-Day Movement: -22.5%

Maker enjoyed the Coinbase Pro effect last week, as the crowd jumped on the 33rd ranked market cap project after it catapulted to a high of $530 in late May. Once hitting near the top of Santiment's Emerging Trends, however, things quickly dropped off, and we now sit nearly $100 below this high from just five days ago (~-20%). Volume predictably dropped off after the Coinbase Pro excitement died down, but it has jumped up slightly. This coin was relatively obscure to the mainstream crowd before the news of it being integrated on to one of the largest exchanges in the world. So we would expect that this higher volume could become the new norm for quite some time now that it is a part of Coinbase Pro.
Rating: 7.5
Daily Active Addresses vs. Price Divergence

The massive spike over 1.0 on MKR's DAA vs. Price chart here coincided more or less with the top, as daily active addresses were flooding in to close out May. These FOMO'ers were punished severely, though, as June saw a steep drop in enthusiasm. We are now back to mostly neutral divergence, though yesterday did see a bullish divergence around 0.15. We do anticipate that unique addresses will continue to push prices up here with it being an available asset for a large community on Coinbase Pro that didn't really have access to trading this much before. So more bullish divergences are likely going to show up, the way they have in 3 of the past 4 days.
Rating: 7.0
NVT

MKR's June NVT output looks strong after a phenomenal close-out to May. Ignoring the yellow-orange color because our databases only have one day of NVT data for Maker thus far in June, most of the past 10 days have been filled with significantly higher than average token circulation, and the new Coinbase Pro listing of course is the biggest contributing factor. Nevertheless, these are great numbers we're seeing, and when combining this fact with MKR's continuous bullish divergence in NVT since December, a 7th straight month is pretty likely, and foreshadows a continuous price rise barring a negative story leading to FUD.
Rating: 10.0
MKR Average Rating: 8.2 (Bullish)
----------------------------------------------------------------------------------
Altcoins have been getting a higher than usual amount of attention over the past couple weeks, and for good reason. We're continuing to see huge surges in waves ever since prices of the entire crypto markets began recovering shortly after Black Thursday occurred. LINK and MKR are two projects we continue to have strong confidence in due to being what we consider strong developing projects with great future use-cases in the industry, as well as us seeing some good recent on-chain data coming in from their respective blockchains. It may be a gut instinct to profit take and hold out when prices have already jumped as much as they have in crypto for the past 2.5 months, but we're seeing signs that bullish conditions are only heating up for many, many assets out there.
Click this survey link to receive your 10% discount for your first month’s subscription to Sanbase, make your comments, and cast your votes for next week!
Thanks for reading!
If you enjoyed this insight please leave a like, join discussion in the comments and share it with your friends!
Never miss a post from brianq!
Get 'early bird' alerts for new insights from this author

Conversations (0)