Best of Santiment's AMA on r/ethfinance (Monday, Nov 18th)

On Monday, the Santiment team held a 3-hour AMA session on the r/ethfinance subreddit, answering questions on crypto analytics, sharing the company roadmap and giving their views on the state of the market.
The AMA was chock-full of great, thought-provoking questions and we had a blast talking with the community. We also gave away 15 monthly Sanbase Pro subscriptions to the most upvoted commenters - hope you guys are enjoying the full site!
Below is the transcript of some of the best Q&A’s from Santiment's AMA session. Check out the full AMA here.
P.S. a big THANK YOU once again to r/ethfinance mods for hosting the AMA. Look forward to doing it again soon!

Q: Some unscrupulous blockchain promoters in the space use specious data to tell distorted stories around their chain’s use and adoption. How can onlookers separate fact from fiction in an environment where usage numbers are often the result of spoofing?
A (Valentin): There are similar problems on the Internet, like bot simulating traffic, fake news, etc. Even though some blockchains, mainly Proof of Stake-based, allow to generate a large volume of transactions at a very low/zero cost, it is important to remember that all these actions are written permanently on the blockchain and can be analyzed in retrospect. Given that, I believe developers and companies like ours, will develop better and better tools to identify fake volumes, wash trading and market manipulation.
For example, we developed a metric called “Token Velocity”, which measures the average amount of times tokens move between addresses each day. It is the same as “Money Velocity” in the traditional markets: https://en.wikipedia.org/wiki/Velocity_of_money Nice thing about the blockchain is that we can compute this metric accurately as we see all the transactions over a period of time.
Using this metric we found there is abnormal activity on ETH between mid-2016 to the beginning of 2018. During this time, the on-chain transaction volume is inflated, because the same tokens are being moved over and over again between addresses (this is the time when the infamous ETH mixer was active). This metric should be around 2-4, but during this interval it was over 10.
See image:

Q: As we potentially transition to a bull market, what are some of the indicators we as investors should be keeping an eye on?
A (Maksim): The healthy bull market should be visible on the data level through strong consistent boost of:
- On-chain volumes (DAA, Transactions, new addresses added to name the few)
- Social volumes
- Trading volumes on exchanges
Exchanges on the last place as it's still heavily manipulated.
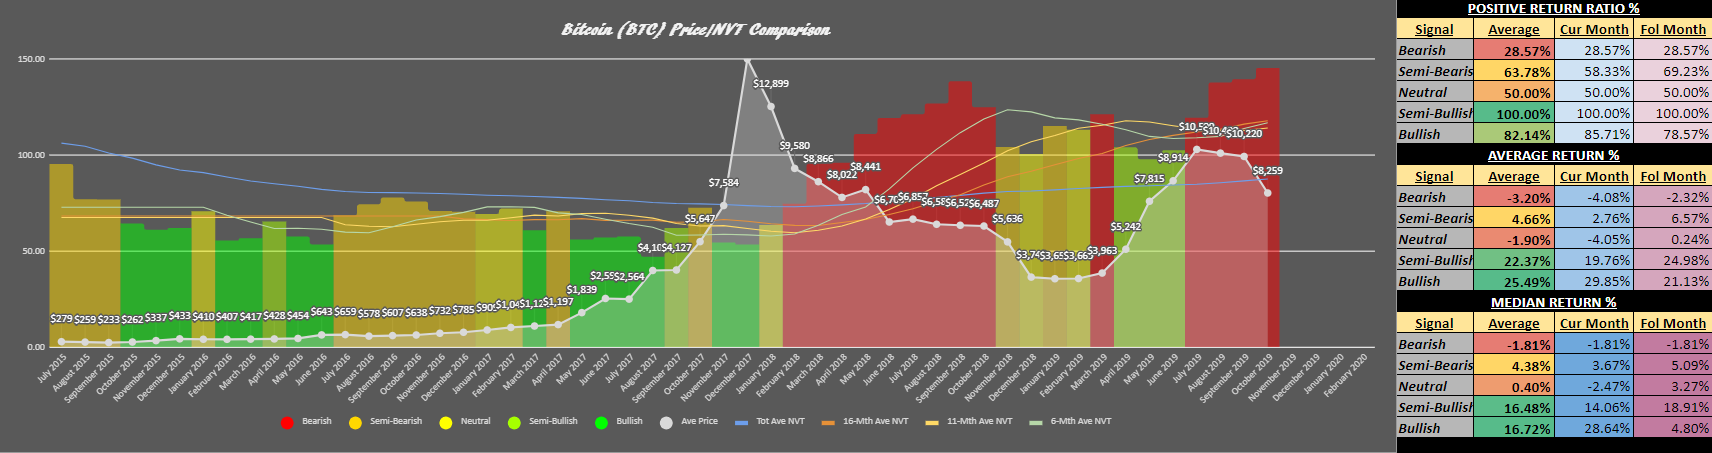
A (Brian): My personal favorite is NVT, as Santiment's version uses token circulation as opposed to transaction volume to measure where an asset's market cap currently stands in comparison to the amount of actual network activity it's receiving from a circulation perspective.
I'll be releasing a big article about it later this week, but you can see by these charts I made for Bitcoin and Ethereum using Santiment's data on Sansheets that there is some serious correlations and leading indications in the colored signals it gives, compared to the monthly price return percentages of these assets in the current and following month of that respective signal's output.
A: (Valentin) I would say time-bound MVRV, as extreme values of TB MVRV indicate the top of the price. Here is an example for LINK and 1y MVRV. Values over 100% indicate very large risk for being a top.

Also mean dollar invested age (similar to mean token age, but normalized in the dollars invested). This metric start decreasing near the top of the market. Again example for LINK:

A very simple metric to look at is daily active addresses. Extreme values there also indicate very high levels of risk that the momentum of the bull run will exhaust soon. Here is an example for BTC:

Q: After the creation of all these products do you still see the need for the SAN token? Would ETH be a better alternative, if not why?
A (Maksim): Yes, we strongly believe we can create a better platform with the SAN token as the centerpiece than without it. Even right now, while SAN is still a discount token, many of our users go the extra mile to buy and stake SANs to claim their discount and support the project. Also, as the team holds more than 10 million SAN (which is potentially the biggest source of our income) we are naturally inclined to find new ways to leverage this resource more effectively. This means, among other things, exploring the best ways to develop a decentralised platform governed by a coherent set of rules and according to the committed SAN tokens holders. All of these functionalities would be impossible with ETH as the cornerstone token.
Q: So, some feedback and a question. You really are the best in crypto with the breadth and quantity of information you make available - however I personally find it incredibly hard to keep track of all the possible metrics, indicators.
Now the question: is there some way that you could quantifiably back test all the various ways to look at onchain data and show which indicator has provided the most consistent signals for either buying or selling.
I feel we need better ways to process all information and really teeth all the best ones. This could be a % or perhaps "if you invested in this asset everytime it have this signal your cumulative returns would be £$"
A (Maksim): Very good question! Short answer - yes.
Long answer - this is one of the challenges we’ve been working on in the last few months. Validating a strategy, regardless of what dataset it’s based on - gets tricky fast. For example: we know from experience that two of our own metrics in particular have helped us predict plenty of tops. Of course, it’s not a 100% success rate, but they’ve both been on the money dozens of times.
To create a data-driven strategy on top of these metrics, we need to wrap it up in some framework. It can be like you said, or in this particular case - since we’re spotting tops - it can answer a question like: “how often, in %, after the signal fires has the asset decreased in value over the next x days?”
To provide a proper answer, we then need to check all signals generated (and not only those that we’ve used/seen work personally) for all assets. We must also apply several limits and conditions, since these metrics/signals often can’t be applied indiscriminately on every single coin (for instance, one of these two signals underperforms for top 5-10 assets because the data gets too noisy).
This is just an example of a few challenges that we come across when attempting to validate a data-driven strategy. The good news is - we’ve been actively focusing on this problem lately, and I’m quite optimistic that we’ll come out the other side with a functioning framework. But keep in mind - the ‘alphas’ we uncover through this methodology will disappear over time as the market starts using them (for example, the price will likely begin to top earlier in many cases). So even once we identify, properly backtest and broadcast these signals, their effective half-life will likely be limited.
Would you be interested to get early access to this framework? We plan to keep the list limited (due to the reasons above)
Q: What are the most surprising insights you've stumbled upon this year, where data has gone against a personal preconception or bias?
A (Maksim): Good one. Let me share my painful experience.
We have at Santiment the general approach - if the crowd is having a consensus on something, you'd better be against it. It works most of the time quite nicely. Especially if it's about hype ("it will be the new BTC/ETH", you know).
But. There is catch. As I saw it working over and over again, I've got too confident. So, on one day BNB (Binance token) appeared on radar of our "social hype traction tool" and I marked it as "becoming top".Yet, to my surprise - it wasn't the top (only temporarily one). Instead BNB grew from around 10 to the top of 35. I've learnt the limit of "purely social data-based analyses". One needs to pay closer attention to the "fundamentals". In this case it was the emerging hype for IEO and I didn't took this part into account.
Q: What has been your biggest learnings at the highest level about the cryptospace while building your analytical tools and dashboards? Very curious to see how your experience with so much data has shaped your outlook in the coming few years.
Thanks for so much engagement with our community!
A (Maksim): Two biggest learnings:
- 1. Crypto is here to stay. And it is in direct conflict with the established financial system. (Btw, that’s probably the core reason why Libra has no chance, imo). Cryptocurrencies bring efficiency, transparency and a whole new paradigm of how value can both be generated and shared. Changes that will be ushered in by DLT - socio-economic, political and even ethical - will be tremendous and some are already on their way.
- 2. To understand crypto one needs to understand the innate “behaviour of networks”; networks created by humans. It’s not exactly a new category, but it’s novel in a sense that, for the first time in history, these kinds of networks are created ‘en masse’, and can generate (bring) profit to its participants. We didn’t have access to these types of fintech mechanisms before - at least not at scale - so the knowledge on how to effectively measure (value) these networks doesn’t exist yet. This know-how is slowly getting codified however, and I’m so happy that we’re part of that movement.
That’s why it’s so exciting to be here right now, as we get closer and closer to proper “valuation models” (in our terms - “behavior analyses”). It’s not just going to be profitable for a select few, but will also reveal so much about our own, human nature.
Q: Have you come across short term factors that correlate to price movements? If yes, how correlated are those factors?
A: (Maksim): Yes. And not just one, but quite some. Things like "big holders accumulations/distributions" (especially if one tracks it completely, all the way to the exchange), "social hype (shill)" have almost immediate impact on the price (read: the results are visible in the first 48 hours max)
Followup Q: Do you do something along the lines of a correlation coefficient? Even side by side graphs would be cool!
Followup A: (Maksim): Side by side graphs do exist already. We call it "visual back testing". Correlation coefficient.. May be join our discord and we continue the talk there? I believe there are quite few related topics and this thread (AMA) is about to be locked. Ping me on the discord under "balance" name.
Q: What differences have you guys found in the data between traditional markets and cryptocurrencies.
A (Valentin): Couple of differences I notice, divided into good and bad categories:
- Good - Cryptocurrency fundamentals can be monitored in real-time as opposed to traditional markets where data is released on a quarterly basis. This allows much faster and accurate price discovery.
- Bad - Cryptocurrency markets has much more market manipulation and FUD in them. Prices are driven much more by pump and dump schemes, hype and fake news, than by fundamental indicators. This is getting better and better over time.
- Neutral - We are still in the process of discovering what the true fundamental indicators are for the cryptocurrencies. We are progressing in this field and from our research, it seems like daily active addresses and value being transacted over the networks are definitely good fundamental indicators for blockchains used for transfer of value, like BTC and ETH. We are about to find out what these indicators are for blockchains that rely on proof of stake.
Q: I often see “new addresses” used as a metric to support the theory that new users are entering this space. Personally, I don’t condone that theory because its likely to be partly true (I’m sure there are new crypto users creating MetaMask wallets for the first time or using their newly ordered Trezor etc). But, that metric alone can easily get muddied with other statistical noise, making that metric alone, imo, unable to support that theory. For example, there are likely developers who are creating new wallets all the time, distorting this metric. How do your tools combine different data sources to further analyze and support or discredit this “new addresses” metric that’s so often seen?
A (Dino): Great question. We also provide this ‘new addresses’ (we call it Network Growth) metric in our tools, and while it’s not without its faults, it’s still one of the best approximations of network adoption, especially if you observe it over time as a long-term health indicator.
For example, take a quick look at the Network Growth chart for MKR or BAT, both of which continue to grow since the ICO days, versus a sea of altcoins whose most prominent ‘new addresses’ spike was around its token sale, and has since fallen into oblivion. Even accepting that spikes can be orchestrated, the long-term trends are undisputable.

Important thing to note in response to your ‘developers creating new wallets’ point: the way we calculate this metric, it only includes addresses that have engaged in a transaction (sent or received coins) on a given day, i.e. actually participated in some sort of value transfer on the network.
But yes, even the ‘new addresses’ metric can be skew-able, so it’s best to look at it in conjunction with other network activity indicators, like on-chain transaction volume, coin days destroyed and HODL waves (amount of active coins in different time frames).
In our metrics we also provide a breakdown of holder distribution - currently for ETH and all ERC-20 coins - which can give you a better idea of exactly which holder segments are growing and how much they’ve added to their cumulative balances over time, as an additional context.
One idea we’ve been thinking of as a complementary metric to ‘new addresses’ is to calculate the amount of new addresses created daily as a result of token withdrawals from exchange wallets, which should remove some of the noise and edge cases you’re referring to. Would that metric be interesting?
Q: If you had to pick, what would you say are the three most useful metrics available in determining a coin/token's staying power?
A (Dino): Personally, the ones that I like to look at on a daily basis would be:
1. Network Growth (new addresses) + Daily Active Addresses - not perfect metrics, but still very good on-chain proxies of network activity and adoption over time. Short-term, these metrics can often indicate strong price trend reversals, but long-term, they reveal a lot about the network’s appeal and sustainability. (Both available on Sanbase.)
2. On-chain Transaction Volume + Token Circulation - how much value is actually being transmitted on the network and what are its longterm trends? I also like to compare on-chain Trx Volume (all tokens involved in transactions on a given day) with Token Circulation (only unique coins involved in transactions on a given day) to check if the Trx Volume numbers may be inflated. (Both available on Sanbase)
3. Social Volume - how much is the crowd actually talking about your project, what’s the general sentiment and how has it changed over time? (Social Volume is available on Sanbase, crowd sentiment is available on graphs.santiment.net/social)
A (Brian): My personal choices are NVT, Mean Dollar Invested Age, and Token Age Consumed. All three are available for several assets on SanGraphs.
Q: What are your predictions for the next bull cycle based on historical data? E. G. Will it begin with bitcoin halving Total market size Where do you predict the greatest growth in market share? Flippening when?
A (Brian): The truth is that anyone who believes they know for certain what kind of bull cycle (and how big of a price jump) we will see, is lying to you because there are simply too many factors at play that happen in real-time as a new market cycle begins. Nobody really knows where prices will be and whether it will happen during the BTC halving, etc, including us. However, if we see metrics like NVT, Stock to Flow, Mean Dollar Invested Age, and others begin to show similar indications to what they showed in previous bullish cycles, we have no issue sharing this with our community and subscribers.
Before prices start to turn positive, there often needs to be some serious capitulation and negative sentiment with crypto before we see the major rise nearly all of us are hoping for. Some would argue this already happened when we dipped down to $3,700 earlier this year, but present data can't give us the answer for the future, and our biggest value as a company (in my humble opinion) is our analysis of present on-chain and social data as it becomes available to us in real-time.
Q: Between Bitcoin and its halvening and ETH and its staking, are you seeing any indicators in the data where smart institutional money is going?
A (Dino): I’ll focus on Ethereum here: for the moment at least, ETH whales seem to be accumulating based on what our metrics are indicating. Out of the top 100 ETH addresses, there’s been a steady growth in the balances of non-exchange wallets over the past five months. These addresses alone held 23% of Ethereum’s total circulating supply in early June; and that number’s grown to 25.3% today.

Simultaneously, we’ve also seen a decline in the balances of biggest exchange wallets over the same time frame - they held 9.3% of ETH’s total circulating supply in early June, which is down to 7% today.
This seems to be a market-wide trend. Zooming out on time frame a bit, the cumulative balances of all addresses holding 10-100k ETH increased by 600k ETH over the past 5 months, while the mega whales (addresses holding 100k - 1m ETH) added 1m ETH in the same time frame.

Could the whales be gearing up for ETH staking already? Whatever the reason, the data indicates big players seem to be content with loading up their ETH bags for the time being.
Q: Do you track how correlated the price of cryptos are to the price of Bitcoin, the US dollar, sp500, or other items?
A (Dino): I'll answer this in 2 parts:
1. Do you track the correlation of the price of other cryptos to the price of BTC - Yes, although we haven’t really made this an organized part of our platform yet. In short - the majority of the crypto market still sways with Bitcoin, and true decoupling is rare. For example, when BTC crashed to $8400 in late September, I wrote about the reaction of top 50 coins by market cap to the move. Unsurprisingly, only the stablecoins were in green, and Bitcoin itself was actually the 16th top performing coin in that time :)
This is why it’s super interesting to me whenever I see coins legitimately go against the Bitcoin trend. BAT and LINK did that recently, and I had some theories about why they may have been successful at it based on some of our on-chain indicators.
Also, if you’re curious, about a year ago we tested a strategy that only invests in the lowest-correlated coins to BTC and ETH month over month. The strategy beat out BTC and ETH HODLers slightly, but also proved to be WAY more volatile, which was a surprise (we expected a completely opposite result given BTC’s own volatility).
2. Do you track the correlation of the price of cryptos to USD, SP500 etc - haven’t really analyzed this too much so far. But if the community thinks it's worthwhile, we can definitely look at it closer?
Q: With the crypto/blockchain world being so new, what data tools are you creating, or are using, that are new (or at least specifically helpful for blockchain, despite its lack of utility in most other markets)?
A (Brian): Development activity tracking is specifically one that comes to mind. It's available for free on Sanbase, and you can simply click on the "+" icon under any asset, and you'll be able to highlight it and see it show up on the interactive chart. Here is an article on how we track the Github activity of all projects.
Our emerging trends page is great for identifying what the latest keywords are that are circulating around social media, and the search option to see how any specific keyword(s) you'd like to view has been mentioned over time and how it's compared to the price of any asset.

Another tool is our Sonar alerts, which allow users to be notified any time there is a significant change (based on our suggestion your customization as to what should be significant) in price, emerging trends mention, daily active addresses, price/volume difference, or historical balances. You can get alerts sent in real-time to your email or Telegram. Here's a walkthrough we made that shows how to use these signals and get it all set up to use to its full potential.

And of course, all of our available metrics available on SanGraphs should be considered quite useful for serious investors and traders who want to have an overview on the health of Ethereum and others from various perspectives and analyses.
Q: From your social analysis what is the biggest use case for crypto? What's the biggest complaint?
A (Maksim): Right now - the biggest use case is clearly DeFi (stablecoins included but not limited to it)
Complains are usual - ETH isn't fast, EOS isn't decentralized, BTC isn't evolving and can't be used for payments and so on.
Q: Your MakerDAO dashboard has unique features that nobody else in the space covers, good job on that. MCD just launched so I wonder if you are already working on MCD metrics. Thank you!
A (Maksim): Yes, we do. Might still take a bit of time for testing. Thanks for appreciating the work!
Q: Who is your favourite Pokemon?
A (Brian): Sanichu, and it's not even close.
Check out the full AMA here!
Thanks for reading!
If you enjoyed this insight please leave a like, join discussion in the comments and share it with your friends!
Never miss a post from Ibis!
Get 'early bird' alerts for new insights from this author

Conversations (0)