Behavioral State of Ethereum: A Santiment Report

Note: Santiment team is in Osaka for Devcon 5. If you're around, ping us for drinks!
Over 4 years later, Ethereum remains the undisputed torch-bearer of all dapp platforms. But what does the network look like today - in the post ICO world - and where might it be heading next?
In this report, we take a look at what on-chain, social and development data can tell us about the status quo of the Ethereum network, the historical and present-day behavior of its participants, as well as the long-term evolution and ongoing transition of Ethereum's prospective use cases.
Developer Activity
Since the start of the year, Ethereum core developers have proven increasingly active; a record amount of development activity has been recorded in Ethereum’s GitHub repository between February and June of this year:

Comparatively, Ethereum easily dominates the ’dapp platforms’ category by development activity.
Over the last 12 months, Ethereum has had nearly 4.5 times (+342%) the amount of development work recorded compared to EOS, the 2nd largest platform for decentralized applications:

Dapps have been putting in work too: rain or shine, cumulative github activity of Dapps building on Ethereum has been on a steady incline over the past 2 years (notice the big dip right around New Year’s - even devs need a break)

Network Activity
Q1 and Q2 of 2019 saw a steady rise in network activity, with a growing amount of addresses interacting with Ethereum daily.
The network activity has consolidated slightly following the July correction, tho the network is still witnessing an average of 275000 daily active addresses since.
YTD, the ETH activity peaked on June 1st, when a total of 475000 daily active addresses were recorded:

Complementary trends can be observed in Network Growth - the amount of new addresses created daily on the Ethereum network - as well as on-chain transaction volumes.
At its highest point YTD - again on June 1st - over 17.5k new addresses were created on the network.

On-chain transaction volumes also followed a similar pattern, with the daily peak of 7.95m ETH ($2.07BN) recorded on May 16th:


Zooming out and observing Ethereum’s full life cycle adds additional context to its current network momentum.
While on-chain activity used to be tightly correlated to Ethereum’s price action throughout 2017 and the initial half of 2018, this mirroring effect - while still operative - has weakened over the past 18 months, as we move away from the ICO era and towards increasing utility of Ethereum-based dapps:

Ethereum in the post-ICO world
Since early 2018, Ethereum has shifted from acting as a springboard for innovative ICO projects to facilitating a number of rapidly evolving use cases.
In particular, the field of decentralized finance has ballooned over the last year, with projects like MakerDAO, Uniswap, Compound and others leading the charge.


We can spot clear signs of this transition in a number of on-chain and social indicators.
Deposits, for example, are interim addresses created by exchanges that all coins pass through before touching main exchange wallets. In early 2017, during the ICO heyday and unprecedented rallies, deposit addresses used to make up as much as 40% of all active addresses on the Ethereum network.
As we moved away from token sales and developed robust alternative use cases for ETH, the share of deposit addresses has slipped to all-time lows, and currently comprises less than 10% of network activity.

The present-day network activity has also appeared much cleaner compared to early 2017, when notorious mixers contributed to elevated yet increasingly noisy on-chain transaction volumes:

We can best see this when comparing Transaction Volume to Daily Token Circulation, which only accounts for unique tokens used each day.
While the transaction volume numbers would suggest a severe drop in Ethereum’s on-chain activity starting in 2018, its Token Circulation reveals the network’s true state of affairs.
In actuality, the number of unique Ethereum tokens interacting with the network has remained relatively stable in the post-ICO era:

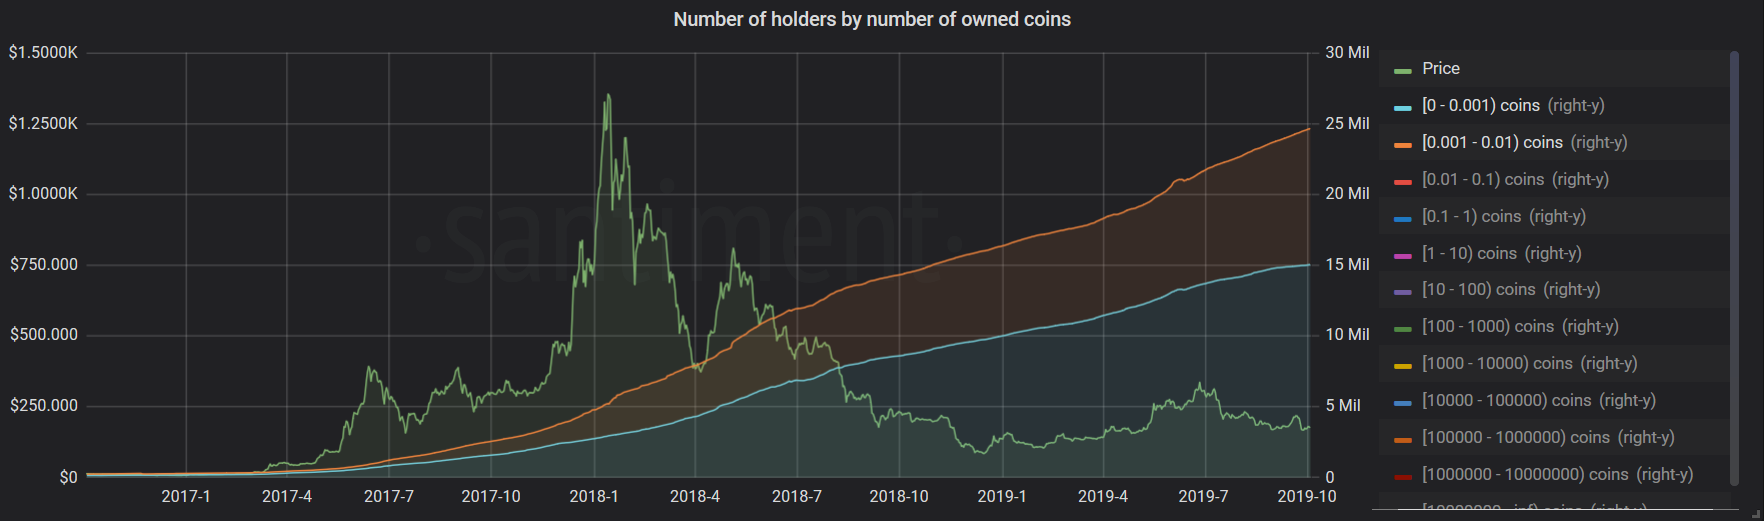
The supply of Ethereum is also decidedly more distributed today than at any time in history. We’re witnessing an unmistaken influx of ETH across holder categories, beginning with ‘micro holders’.
24.6M ETH is currently spread across wallets containing between 0 - 0.01 ETH; year-to-date, this holder category has grown by 8.3M ETH (a 50.5% increase):
‘Retail’ category (addresses owning 1-10 ETH) has also been on a decided uptrend since the start of the year, growing by 69000 ETH (9.7% increase):

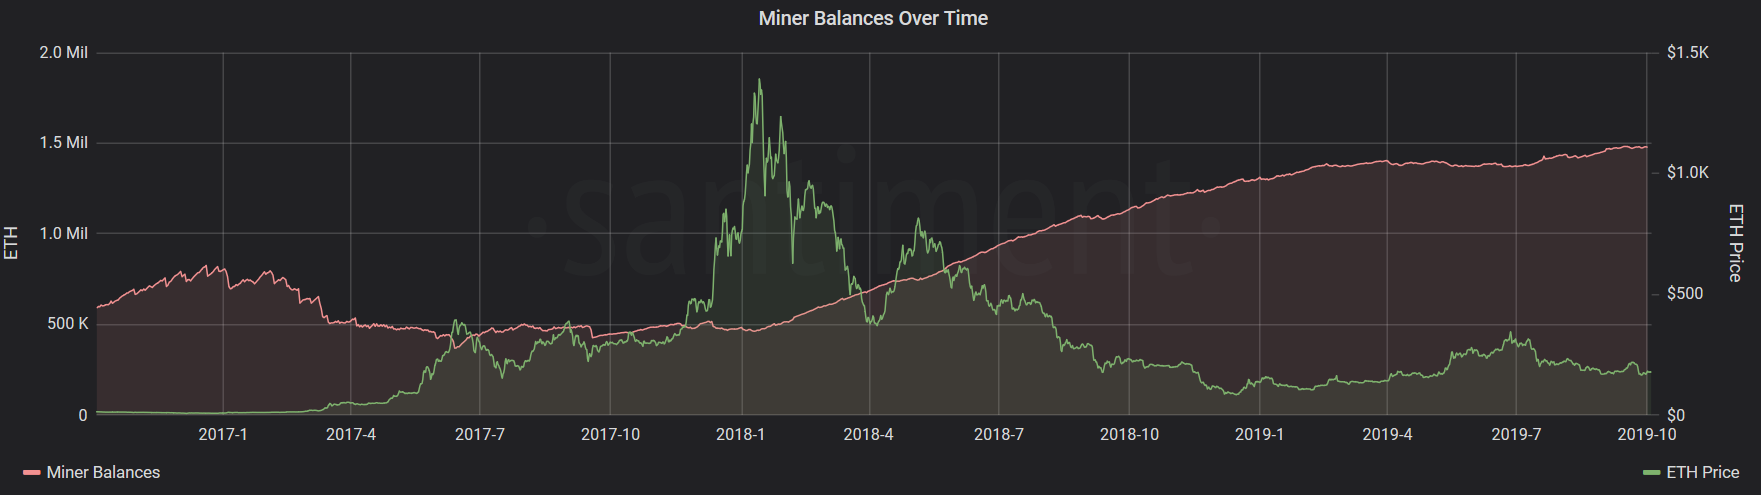
On the flip side of the coin, Ehereum miners have not been letting go of their block rewards; since the start of the year, cumulative miner balances have amassed by 171000 ETH (a 12.5% increase)
Not much has changed in terms of mining pool distribution YTD, as top 3 mining pools hold a 62% mining share (down by just 1% since the start of the year), and 87% of the share belonging to top 10 mining pools.
Meanwhile, after plateauing for most of 2018, Ethereum gas usage has been on a steady incline since February of 2019, and has just recently recorded a new ATH of 61.3BN:

The rise of DeFi
Last 12 months have been a testament to the meteoric growth of Decentralized Finance, a collection of ideas and initiatives to reshape banking, lending, and derivatives with Ethereum as base layer.

The rise of DeFi solutions is perhaps best viewed through the prism of MakerDAO, the largest Ethereum-based DeFi project to date.
Compared to this time last year, the total amount of ETH locked in MakerDAO’s CDP (collateralized debt positions) has increased by 86.9% - from 822k to 1.53m ETH.

At its peak, over 2.23m ETH (approximately, $401m at the time) was locked as collateral in the MakerDAO system.
Paired with recent marketing efforts (including Coinbase’s ‘Earn DAI’ lessons), the amount of newly-created CDPs as well as new CDP users - particularly in q3 of 2019 - has dwarfed all previous data points by a long mile:


Over the last 12 months, the network activity of MakerDAO’s stablecoin, DAI, has also mushroomed both in terms of daily addresses interacting with the coin as well as the number of daily transactions:


Simultaneously, DAI’s mean transaction values have tapered off significantly, signalling the rising adoption of the stablecoin among retail users:

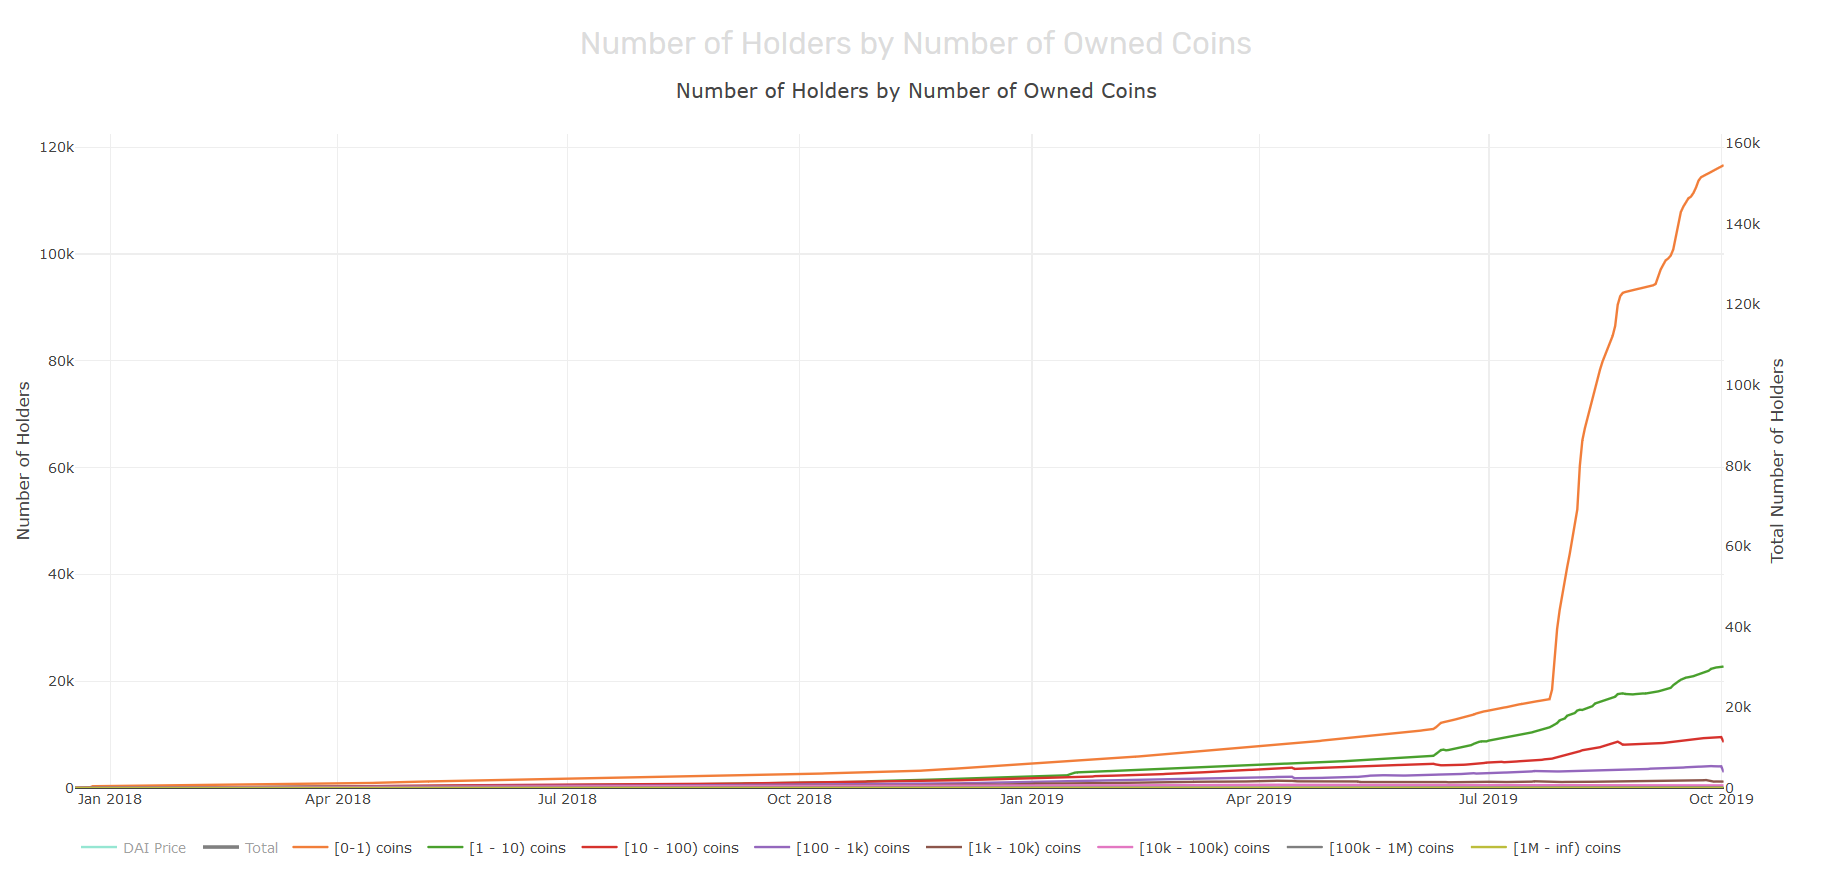
The above premise is further supported by the inflation of new DAI holders across the spectrum, but particularly among addresses holding between 0 - 10 coins:
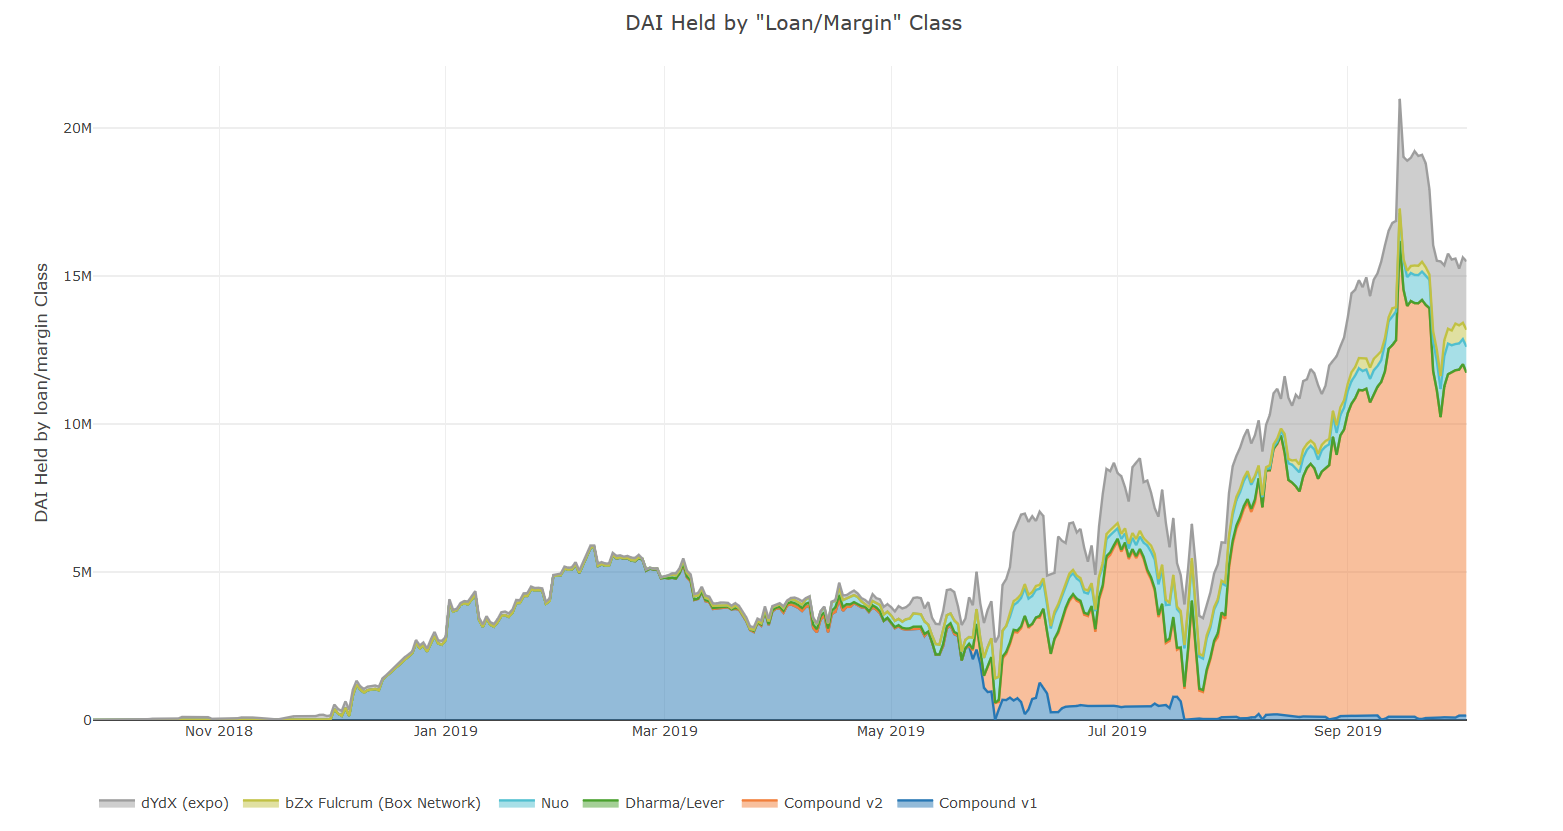
Apart from personal wallets, DAI has become a staple in other lending and borrowing platforms like Compound and dydx; combined, the two projects held just shy of 20M DAI at its (recent) peak:
Congestion and scalability concerns
Over the past several months, the Ethereum network has been nearing full capacity once again, mainly driven by elevated transaction activity of ERC-20 Tether.
The Ethereum-based stablecoin is much faster than its Omni and Tron counterparts and requires less fees, which has compelled several major exchanges to introduce support or outright mandate the use of ERC-20 Tether over the summer.
As a result, Tether has recently accounted for as much as 40% of all ERC-20 transactions:

The surge of ERC-20 USDT’s activity has taken the network by storm; at its recent peak recorded in early September, over 109730 Tether addresses interacted with the Ethereum blockchain in one day:

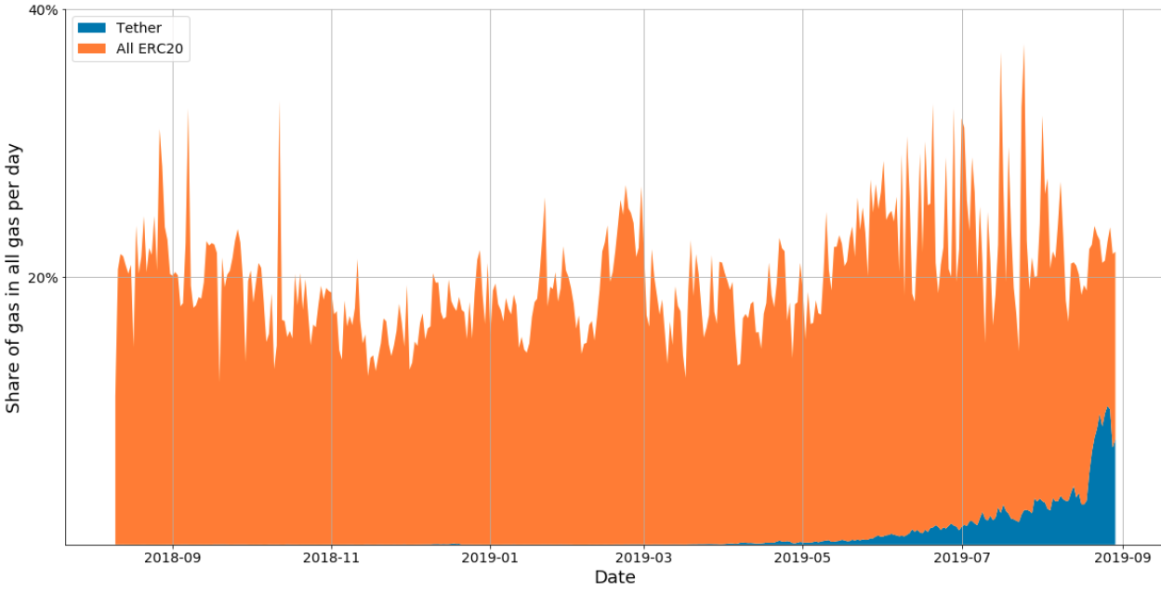
As expected, the share of Tether-related gas fees has been on a decided uptrend as well:
Network congestion is also at least a partial culprit to the plateauing DEX (decentralized exchange) activity over the last 12 months, as evident by the total and segmented number of DEX-related trades over said time frame:

While many have been voicing concerns about the Ethereum network’s congestion and scalability issues in light of ERC-20 Tether’s growth, it’s also worth putting the current network activity in a broader context.
At this very moment, people are proving willing to part ways with a fair amount of their own resources for an opportunity to interact with the Ethereum network. While not optimal, the status quo does provide strong validation - both in terms of network adoption as well as general crowd sentiment.
For more information on Ethereum’s development, social and on-chain activity, as well as the activity of all ERC-20 tokens, visit Santiment.net and our many custom and unique network analysis tools and indicators.
Thanks for reading!
If you enjoyed this insight please leave a like, join discussion in the comments and share it with your friends!
Never miss a post from Ibis!
Get 'early bird' alerts for new insights from this author

Conversations (0)