Bitcoin Broke Out of Its $32k to $36k Range… Then Skyrocketed to $42.5k. So Now What? | Santiment Weekly Pro Report

For those who were beginning to become bored and complacent toward the crypto markets for June and the majority of July, this week was the floodgate opening that many silent bulls were hoping for.
At the time of this writing, Bitcoin has jumped a massive +23% over the past week and sits at a $40.2k market value. This matches mid-June levels, and technical traders have noted that this could be a key resistance level, which if broken, could allow BTC to beeline its way back to $50k and beyond.
In Santiment’s weekly Pro report to end July here, we will not only be looking at Bitcoin’s latest social and network activity, but also touch on the impressive altcoin rally that has propelled many altcoins to make up for lost time.
The Whales’ Playground Finally Resumes Recess Time
As we have been updating for about two months, there has been a serious accumulation pattern developing among our highly touted Bitcoin ‘Millionaire Tier’. These whales are generally regarded highly as Bitcoin’s group of addresses tied most closely to where prices tend to lead next.
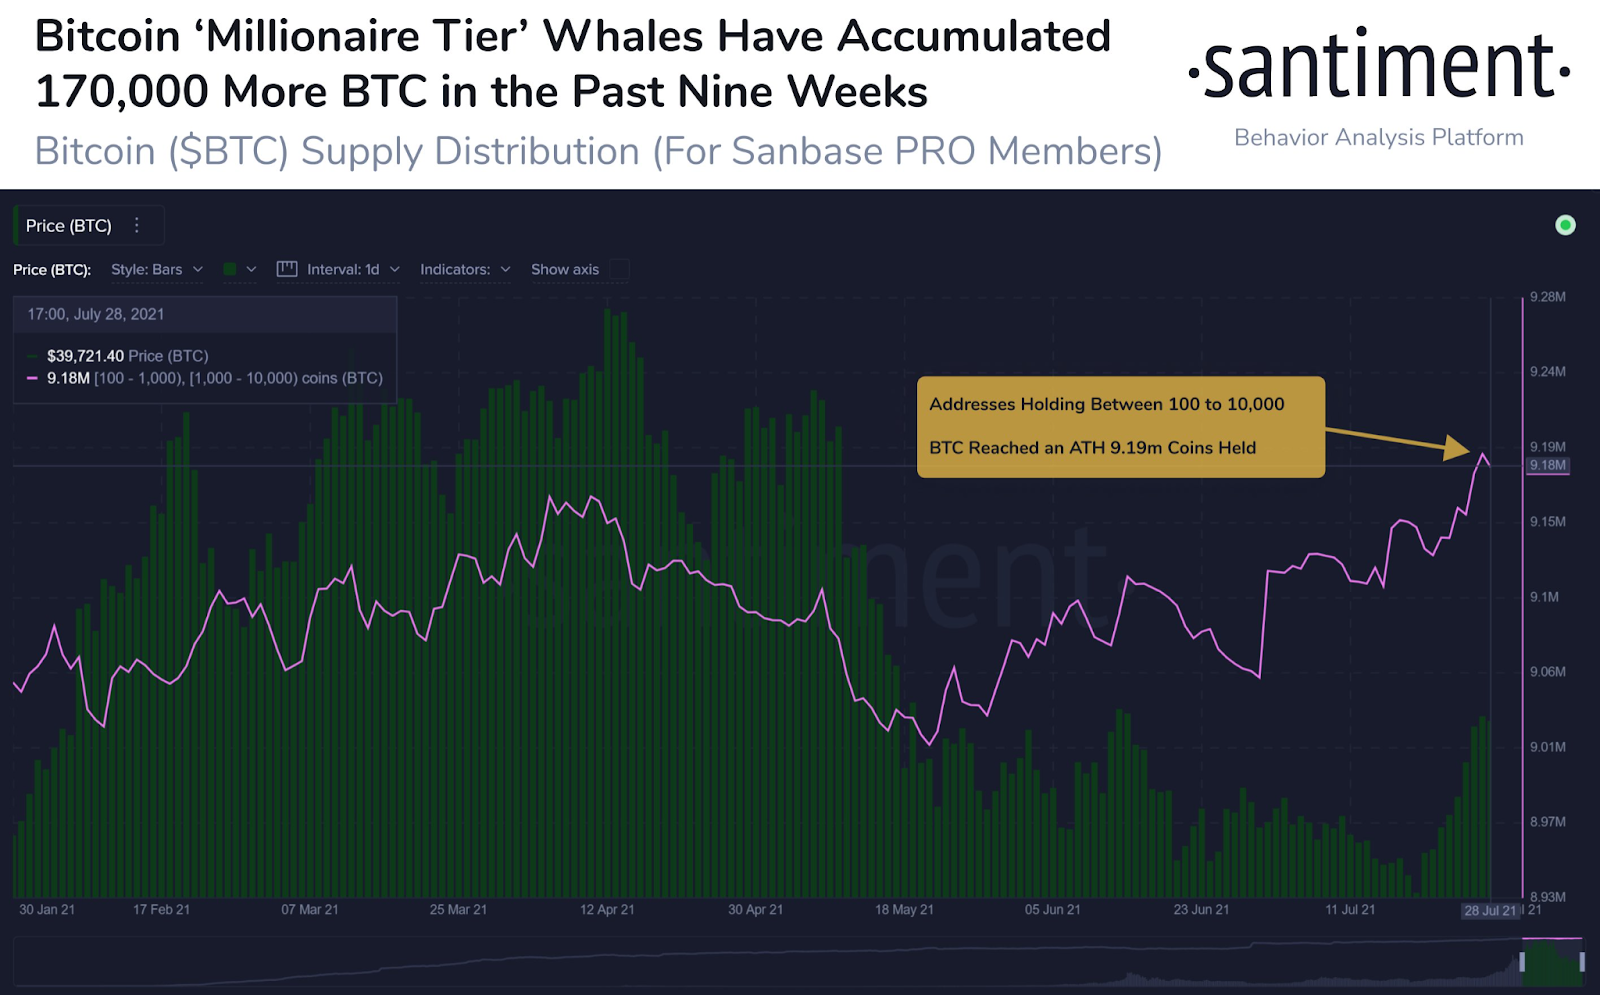
As of the time of this writing, Bitcoin addresses currently holding between 100 and 10,000 BTC now collectively hold 9.23m coins in their wallets, which is a new all-time high for this group. The previous all-time high had occurred on April 5th, just one week shy of Bitcoin’s price all-time high of $63.5k.
In the last four weeks, these addresses have accumulated approximately 170,000 more BTC. This staggering pace was last matched in late December, 2020, right before a massive bull run kicked off 2021 where prices jumped from $29.0k to $40.8k in the year’s opening week. This group is an important one for our community to continue to track, as it will very likely continue to be a prime bullish indicator as long as we don’t see a dip in this accumulation line.
Bitcoin’s Trio of Metrics (Address Activity, Trading Volume, Social Volume) all Surge on Price Rise to $40k
We have often referenced the close relationship between a crypto asset’s daily active addresses, trading volume, and social volume when doing our analysis. Generally, when all three of these metrics have a drastic spike or dip in unison, it’s a promising sign that a major price rally in that direction can have legs.

As we can see on July 27th, this mirror effect between the three metrics for Bitcoin was achieved. As BTC crossed $40k for the first time since mid-June, address activity soared to a 3-week high, while both trading and social volume hit respective 5-week highs. Some may question whether this was a “chicken or the egg” scenario, where the price may have just started the uptick in these metrics, or perhaps vice versa.
But the reality is… it really doesn’t matter. What these three metrics showed by spiking up all together, was that the crowd ramped up its excitement and created a major uptick in utility for crypto’s #1 asset, thus allowing the market price to stay up at $40,000.
Altcoins Follow in Bitcoin’s Footsteps and Pop Off Following Bitcoin’s Earlier Dominance
Altcoiners who stuck with their volatile investments over the past couple of months have been handsomely rewarded for their patience, as the top 100 crypto projects by market cap have rebounded from their losses in a big way. Quant’s +77% and Amp’s +64% week headlined a recovery for alts, which appeared to be triggered by Bitcoin’s own resurgence to above $40k.

As always, the question from here is whether BTC can tread water. If it doesn’t and drops back to the $36k range and below, a whole lot of altcoin market caps will be coming down with it. The unpredictability and heavy volatility is always a byproduct that traders deal with when investing in any asset, and it’s especially true with any asset not named Bitcoin or Ethereum.
Average ETH-Based Trading Returns Spike into Positive Territory
MVRV is another extremely useful metric when it comes to identifying how crowd sentiment will impact the markets on a forward basis. Generally, when average trade returns (MVRV) jump into positive territory (especially at extreme levels), it’s a signal that FOMO is taking effect and a correction is historically imminent.
Currently, however, we aren’t in extreme levels. We are seeing most ETH-based projects have jumped into positive return range, which means that buying now is a higher risk action than normal. But average 30-day returns at 6% to 10% for most assets is not an extreme level like 20% to 30%. If MVRV’s continue to climb close to that range, taking profit would historically be a wise choice.

The best buy opportunities for buying typically come when most traders are in the red and panic selling, but at least for now, that opportunity window is semi-closed. Below is our MVRV Opportunity & Danger Zone Divergence model. When bars for respective projects are in positive territory and in the green, that is typically the time where buying is most justified.

But as we can see, most projects here are below zero and closer to the red dashed danger zone line, as opposed to being near the opportunity line. $OMG and $REN are the two that are at least showing a bit of a buy window, while $QNT, $GLM, and $SNT already have skyrocketed average returns and should be considered risky until profits come down a bit.
Mean Dollar Invested Age Indicates Dormant BTC is Moving Again
Another great macro indicator to help us decipher whether a major market move up or down is justified is Santiment’s Mean Dollar Invested Age. Here, we can look at whether the dollars invested in BTC (in brown) and ETH (in pink) are becoming more dormant, or whether they’re on the move.

During the bull run, both BTC’s and ETH’s mean dollar invested ages were moving down considerably, indicating more and more new dollars were being invested in the markets and dormant investments were being moved. We reported a flattening of this line just as the all-time high was occurring, indicating that things were beginning to dry up.
Since the major price fall in mid-May, these lines have been moving back up, indicating bearish dormancy was occurring. But for the first time in two and a half months, we’re seeing some renewed movement in invested dollars (for BTC at least, not ETH), and BTC’s line is curling down again. If the line continues to move down from here, it can be a prime signal to reveal a second bull cycle may be starting.
Bitcoin & Ethereum Both Still Have a Circulation Problem
Several of Bitcoin’s metrics, as discussed above, are starting to look quite a bit more bullish. But a metric that still needs some work is its token circulation The amount of unique tokens being moved on the BTC network has been concerningly low in the month of July. In fact, based on current market cap levels, our model indicates that it is going to be the lowest amount of circulation from an NVT ratio, in the history of BTC.

This isn’t the end of the world by any means, especially when noting that the past 3 days (illustrated by the three low hash marks on July 2021’s bar) have actually shown a huge improvement in circulation as the crowd has gotten excited about $40k. However, this strikingly accurate model does predict future months quite well based on how the previous month’s color fills in. And right now, it appears July will be the 5th straight month of bearishness.
-----
Looking a little better, but not by a lot, is Ethereum’s NVT chart. At the time of this writing, it did just propel its price up to $2,400 for the first time in over a month. However the orange-yellow bar here indicates a semi-bearish signal.

Unlike Bitcoin, the last three days haven’t really been much more impressive in spite of the excitement being renewed in the markets right now. We advise watching closely to see how these final days of July look from a circulation basis as a clear indication of what direction markets will be heading moving into August.
Disclaimer: The opinions expressed in the post are for general informational purposes only and are not intended to provide specific advice or recommendations for any individual or on any specific security or investment product.
Thanks for reading!
If you enjoyed this insight please leave a like, join discussion in the comments and share it with your friends!
Never miss a post from brianq!
Get 'early bird' alerts for new insights from this author

Conversations (0)